A Global Checkup: Diagnosing the Health of Today’s Organizations
A new Booz Allen Hamilton study detects the sources of organizational dysfunction and reveals where you’re most likely to find companies programmed to thrive.
(originally published by Booz & Company)Most organizations are inherently unhealthy. That hypothesis is inspired by experience, informed by economic theory, and now supported by hard data.
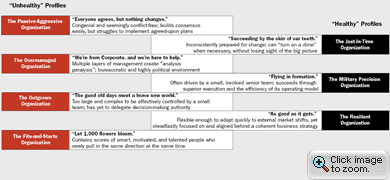
As management consultants specializing in organizational transformation, we have collectively spent decades helping clients identify and overcome the organizational impediments to effective execution. Based on that experience, we have distilled seven basic organization types — three healthy, four unhealthy — that together describe the persistent patterns of behavior we have seen in corporate, government, not-for-profit, and academic contexts. (See “The Seven Types of Organizations,” below.) These types, or organizational profiles, reflect different interactions between and among four basic organizational building blocks: decision rights, information, motivators, and structure.
We applied to this typology some of the pathbreaking work on the economic theory of organizations to help us create an online assessment tool called the Org DNA ProfilerSM. (See “Research Methodology,” below.) This tool enables an individual working in any organization anywhere in the world to come up with a snapshot diagnosis of his or her organization’s type in as little as five minutes. It’s a “personality test” for organizations, if you will. When many individuals from the same organization take the test, the aggregate results reveal the root causes of many performance failures, and pinpoint the areas where a company can focus to improve its ability to execute. Such diagnostic clarity is rare in the world of fixing organizations.
We launched the Org DNA ProfilerSM on www.orgdna.com in December 2003. To date, more than 30,000 individuals have visited the site and completed the survey. In addition, nearly 20,000 more profiles have been generated on client-specific sites set up to facilitate work with our clients in corporate, government, and not-for-profit sectors. In each of these cases, we have created a customized, password-protected site for the client to collect employee input on their organization’s decision rights, information flows, motivators, and structure. The resulting “deep-dive” data sets provide us with a slightly different perspective on how and why individual companies behave as they do, and allow clients to pinpoint the root causes of their organizational breakdowns so they can then fix them. We discuss a few of these client case studies in “How Healthy Is My Company?” (below).
We continue to collect data as new individuals visit the site and complete profiles. Periodically, research updates are made available on www.orgdna.com. This report highlights key findings through the fall of 2005.
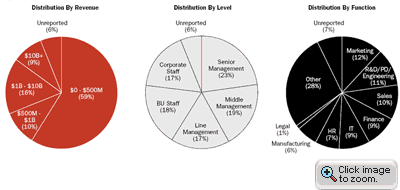
The Org DNA ProfilerSM data set cuts a wide swath across industries, geographies, and organizations. Represented are 24 sectors, from banking to transportation to energy, and more than 10 internal departments/functions (human resources, information technology, legal, etc.). We also have data on each respondent’s position or level within the company (e.g., senior management, corporate staff, etc.) as well as his or her organization’s size. (See Exhibit 1.)
Exhibit 1: Org DNA ProfilerSM Database Includes a Broad Cross-Section of Organizations
Source: Org DNA ProfilerSM data collected from www.orgdna.com, based on 30,000 responses; Booz Allen analysis
With the addition of a “country” field in April 2004, we began capturing information on geographic location, and we now have profiles submitted from more than 100 countries. The site has been translated into 12 languages, including German, Japanese, and Chinese. In short, the data are from an extraordinarily broad cross-section of global organizations and provide a robust sample with which to test our hypotheses.
Global Diagnosis: Most Organizations Are Unhealthy
Nearly 50,000 profiles completed over two years by individuals around the world are consistent with one central hypothesis: Most organizations are unhealthy. That is, most respondents describe their workplace as inherently ineffectual. Our “genetic marker” for an organization’s health is its ability to quickly translate important strategic and operational decisions into action: 54 percent of survey respondents answer that their organizations cannot.
Organizational health, in other words, is the ability to execute. Healthy companies get things done. Unhealthy companies do not. They stumble and, ultimately, stagnate.
Do these complaints sound familiar?
-
“Everyone agrees on a course of action, but nothing changes.”
-
“There goes another opportunity while we wait for a decision.”
-
“It’s a great idea; it’ll never happen.”
-
“I’m either micromanaged or left holding the bag.”
-
“The businesses and functions just aren’t working together to get results.”
-
“I don’t feel motivated to go the extra mile. What’s in it for me?”
-
“We have the right strategy and a clear implementation plan; we just can’t seem to execute.”
These are some of the symptoms of organizational disease and dysfunction. These are the counterproductive behaviors that undermine an organization’s success and lead, ultimately, to its competitive marginalization.
The ability to execute, like health, is not something you can hire or mandate. It is inherent, embedded in the organization’s “genes,” and expressed in the thousands of individual decisions and actions that collectively constitute and define firm performance. The first step in resolving execution breakdowns is to understand how these inherent traits of an organization influence and, in some ways, even determine how each individual thinks and acts on the job. That behavior is what drives results.
As Exhibit 2 shows, less than a third of the 30,000 respondents who have completed surveys on www.orgdna.com report traits and behaviors consistent with a “healthy” profile. More than half the survey responses resulted in one of the four “unhealthy” profiles, Passive-Aggressive being by far the most prevalent. (For more detail on the Passive-Aggressive organization, see “Passive-Aggressive Predominates,” below.) In other words, by a margin of nearly 2-to-1, respondents declared that their own organizations could not execute: Strategic and operational decisions were not quickly translated into action. Hence our most salient finding is a very simple and sobering one: Most organizations, by their own employees’ admission, are sick.
Exhibit 2: Unhealthy Profiles Outnumber Healthy Ones Almost 2-to-1
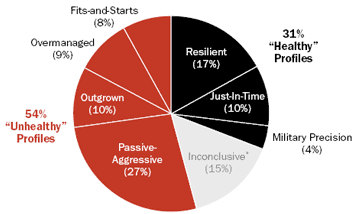
*Respondents who generated an “inconclusive” response reported traits and behaviors that either match multiple profiles or display uncommon patterns.
Source: Org DNA ProfilerSM data collected from www.orgdna.com, based on 30,000 responses; Booz Allen analysis
Some Countries Are Healthier Than Others
We began collecting data on respondents’ location several months after launching the Web site. Since then, we have received more than 15,000 responses with complete information on location, which reveal significant differences across regions and countries.
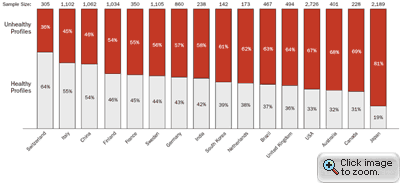
Twice as many identified Europeans have taken the survey as identified Americans, and their responses, overall, tend to be much healthier. In fact, comparing the proportion of healthy profiles reported across countries with sufficient data (100 observations or more) shows every European country ranking higher than the United States. (See Exhibit 3.) What’s more, this finding holds across all revenue segments and management/staff levels.
Exhibit 3: Regional Distinctions in Organizational Health
Source: Org DNA ProfilerSM data collected from www.orgdna.com, based on 12,958 responses; Booz Allen analysis
A second arresting finding is that China is one of the most robust nations when it comes to organizational health. More than half (54 percent) of all surveys completed in China resulted in a healthy profile, versus 31 percent in the overall sample (30,000 responses) and only 33 percent in the United States.
In fact, the United States is among the most unhealthy of organizational environments according to our data. Among countries with sufficient data, only Japan, Canada, and Australia fare worse.
Analyzing the question-level data further, three traits appear to be especially strongly correlated with organizational health among respondents from the United States. Among U.S. respondents generating “healthy” profiles:
-
70 percent agree that “information flows freely across organizational boundaries.”
-
61 percent agree that “field/line employees usually have the information they need to understand the bottom-line impact of their day-to-day choices.”
-
60 percent agree that “everyone has a good idea of decisions/actions for which he or she is responsible.”
Healthy Companies Reap Better Results
Not surprisingly, organizational health and financial success are correlated. In fact, healthy organizations are nearly twice as likely as their unhealthy peers to report better-than-industry-average profitability. (Profitability is reported using a survey question that asks respondents to indicate whether their companies are “more profitable” than their industry’s average, “less profitable,” “about the same,” or “unknown/inapplicable.”) Although 48 percent of respondents who generated healthy profiles report better-than-average profitability, only 27 percent of those who describe their organizations as unhealthy do so. (See Exhibit 4.)
Exhibit 4: Healthy Organizations Report Greater Profitability

* Percentages do not total 100 percent due to rounding.
Source: Org DNA ProfilerSM data collected from www.orgdna.com, based on 12,465 responses; Booz Allen analysis
A closer look at the results question-by-question reveals that the traits most highly correlated with superior profitability are an ability to quickly translate strategic and operational decisions into action and the capacity to deal well with discontinuous change in the competitive environment. (See Exhibit 5.)
Exhibit 5: Execution and Adaptability Correlate with Superior Profitability

Source: Org DNA ProfilerSM data collected from www.orgdna.com, blank answers excluded; Booz Allen analysis
All Industries Suffer Significant Organizational Dysfunction
Looking across the entire data set, no industry emerges as particularly healthy. Even in the “healthiest” industry (real estate), less than half of survey responses result in a healthy profile. And it gets much worse: In the least “healthy” industry (utilities), less than one-quarter of responses indicate a healthy organization.
The unhealthiest industries are remarkably consistent across revenue segments, so organization size alone does not drive this result. (See Exhibit 6.) For example, compared with other industries, utilities and health care fall in the bottom “health” quartile in all four revenue segments. Capital goods and energy companies are among the bottom six industries in three out of four revenue segments. We believe that these unhealthy organizations survive because they compete in regulated and/or capital-intensive industries where high barriers to entry likely protect them from failure. In contrast, more “healthy” industries — professional services, commercial services, hotel and leisure, real estate — tend to be more openly competitive.
Exhibit 6: Sector-Level Differences in Organizational Health

Source: Org DNA ProfilerSM data collected from www.orgdna.com, based on 23,089 completed observations; Booz Allen analysis
Unhealthy Organizations Lack Clear Decision Rights
Despite their obvious importance in determining how an organization will perform, decision rights (i.e., who decides what) are poorly defined in a surprising number of companies. Only 43 percent of overall respondents believe that people in their organization have a clear idea of the decisions they are responsible for. Among “unhealthy” profiles, that number drops to 23 percent. Fewer than one in four people know where their job ends and another person’s begins. In contrast, nearly 80 percent of “healthy” respondents agree that everyone in their organization has a clear idea of the decisions/actions for which he or she is responsible. (See Exhibit 7.)
Exhibit 7: Decision Rights Are Unclear in Unhealthy Organizations

Source: Org DNA ProfilerSM data collected from www.orgdna.com, blank answers excluded; Booz Allen analysis
Still more evidence that decision rights are unclear in unhealthy organizations is that three out of four responses from “unhealthy” companies agree that decisions, once made, are often second-guessed, compared with 37 percent of respondents from “healthy” companies. Second-guessing is a common symptom of ill-defined or poorly articulated decision rights.
That said, simply clarifying decision rights won’t serve as a cure-all. Decision makers cannot make effective decisions in the absence of accurate and relevant information. And, as the next finding indicates, incomplete or inaccessible information is a hallmark of the unhealthy organization.
Inadequate Information Flows Plague Unhealthy Organizations
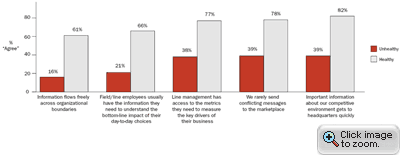
Despite decades of advancement and investment in IT, most organizations still have difficulty getting information where it needs to go. The responses to Org DNA ProfilerSM questions on information show a marked disparity between healthy and unhealthy organizations. (See Exhibit 8.)
Exhibit 8: Information Stagnates in Unhealthy Organizations
Source: Org DNA ProfilerSM data collected from www.orgdna.com, blank answers excluded; Booz Allen analysis
A mere 16 percent of those respondents who described their organizations as unhealthy report that information flows freely within their organizations, and only one in five feels that field and line employees have the information they need to understand the bottom-line impact of their day-to-day choices. More than three times as many “healthy” respondents agree with these statements.
Only two in five “unhealthy” respondents agree that line managers have the metrics they need to drive the business, that their organization rarely sends mixed signals to the market, and that important information gets to headquarters quickly. Healthy respondents are twice as likely to answer these questions in the affirmative.
Larger Organizations Are Less Healthy
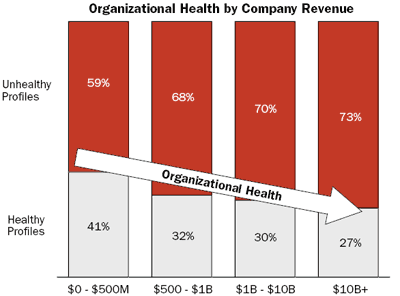
Although our data are cross-sectional rather than time-series, they suggest that “healthy” growth is hard to achieve. Specifically, examining profile distributions by organization size (measured by revenues) shows that responses from small organizations are more likely than those from larger ones to result in a healthy profile. (See Exhibit 9.) In other words, smaller organizations are generally more effective at executing. By contrast, large organizations are more likely to manifest dysfunctional traits and behaviors and report unhealthy profiles.
Exhibit 9: Organizational Health Declines with Size
Source: Org DNA ProfilerSM data collected from www.orgdna.com, based on 24,025 completed observations; Booz Allen analysis
These results and our experience working with clients of all sizes suggest that organizational DNA changes, or mutates, as organizations grow and adapt to changes in their competitive environment, and that these changes are often for the worse.
Altitude Determines Attitude: Senior Management Is High on Organizational Health
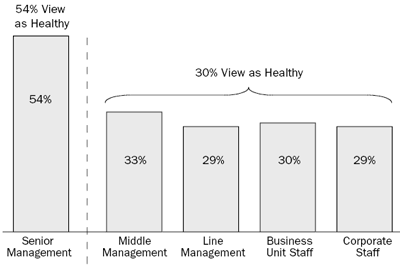
The Org DNA ProfilerSM has generated interest at every level: 23 percent of respondents identify themselves as senior management, 19 percent as middle management, 17 percent as line management, 18 percent as business unit staff, and 17 percent as corporate staff. Our survey results indicate sharp differences, however, in perception between senior management and the rest of the organization. At the same time, the four non-senior-management groups show remarkable consistency in their outlooks.
More than any other group in the organization, senior executives responding to the survey perceive their firms as high-functioning, reporting healthy profiles more than half of the time. (See Exhibit 10.)
Exhibit 10: Senior Management’s Bullish Attitude Sets Them Apart
Source: Org DNA ProfilerSM data collected from www.orgdna.com, based on 24,032 completed observations; Booz Allen analysis
In contrast, line and midlevel managers and business unit and corporate staff tend to be consistently pessimistic in their assessment of organizational effectiveness. Across the board, their responses result in unhealthy profiles 70 percent of the time.
Digging into the question-level data, it becomes clear that not only is senior management out of touch with the rest of the organization, but they don’t know what they don’t know. Nearly two-thirds of senior managers agree that “important information gets to headquarters quickly,” whereas only half of their subordinates agree. The executive floor at many companies would appear to be cut off in more ways than one.
Curing What Ails You: Organizing to Execute
Results from the Org DNA ProfilerSM overwhelmingly support the hypothesis that most companies today suffer the ill-effects of unhealthy organizational design. In other words, they are being thwarted from within. But our research goes beyond discriminating between “healthy” and “unhealthy.” Each individual respondent generates a profile that 85 percent of the time falls into one of seven specific organizational types, each with a distinct personality and set of distinguishing characteristics.
Four of these profiles — Passive-Aggressive, Overmanaged, Outgrown, and Fits-and-Starts — are “unhealthy,” but each is unhealthy in a different way. Each exhibits a specific combination of dysfunctional traits and counterproductive behaviors. The first step in fixing these problems is to identify and isolate them. That is the purpose of the Org DNA ProfilerSM . Using a framework that examines key aspects of an organization’s design, the tool allows management to see what is working and what isn’t, deep inside a highly complex organization. Moreover, it serves as a “search engine,” directing management to practical and actionable information on the remedies most relevant to their particular situation. (For more information on remedies, see RESULTS: Keep What’s Good, Fix What’s Wrong, and Unlock Great Performance, by Gary L. Neilson and Bruce A. Pasternack [Crown Business, 2005].)
|
The Seven Types of Organizations Eighty-five percent of all responses to the Org DNA ProfilerSM fall into one of these seven “personality” types, which not only describe an organization’s typical traits but also explain its shortcomings and even predict its behavior. Source: Booz Allen Hamilton |
|
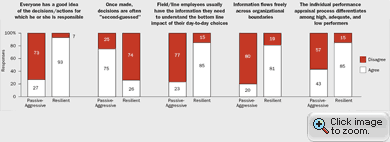
Passive-Aggressive Predominates In Passive-Aggressive organizations, people pay those directives lip service, making only enough effort to appear compliant. Looking more closely at Org DNA ProfilerSM question-level results, however, it is clear that execution is far from their highest priority. In contrast to responses from the healthiest Resilient organizations, people working in Passive-Aggressive organizations feel strongly that they don’t know which decisions they’re responsible for, that no decision is ever final, that good information is hard to obtain, and that their performance is not accurately appraised. (See chart below.) That said, the Passive-Aggressive organization is not one where bad outcomes can be attributed to individuals’ hostile or perverse intentions. It is, in fact, a place where mostly well-intentioned people are the victims of flawed processes and policies. Passive-Aggressive organizations are the result of entropy and expediency and historical accident, laced with the occasional bout of bad behavior left uncorrected. Ultimately, an organization becomes Passive-Aggressive because that is the path of least resistance: It reflects a decision made by all the individuals in an organization, most of them well intentioned, to not fight what they believe they cannot change. —Adapted from Neilson et al., “The Passive-Aggressive Organization,” Harvard Business Review, October 2005 The Root Causes of Passive-Aggressive Behavior Source: Org DNA ProfilerSM data collected from www.orgdna.com, based on 30,000 responses; Booz Allen analysis |
|
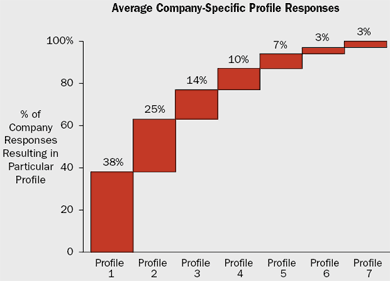
How Healthy Is My Company? We collect and analyze the data, cutting it many ways to yield a multidimensional diagnosis. First, we look at the breakdown of employee responses by profile and compare it to responses from peer organizations (e.g., in the same industry, of similar size, in the same country) and to the global data set. We also examine the answers to specific questions to identify where the breakdowns are occurring in, between, and among the various organizational building blocks — decision rights, information, motivators, and structure — and how, again, that compares to peers and the overall data set. We also frequently analyze the data by department or unit and by management level to tease out these distinctions (i.e., best and worst practices, differences in perspective), as well as other dimensions relevant for a particular client. Not every employee in a given company will generate the same profile: Each organization is a mosaic of different perspectives. However, there is invariably a strong center of gravity around which responses from a single organization cluster. On average, the most common profile generated at a single company, whether it be Passive-Aggressive, Fits-and-Starts, Military Precision, or another type, will account for close to 40 percent of all responses in that company. The two most common profiles will account for more than 60 percent of responses, on average. (See exhibit below.) Any Organization Is a Mosaic of Types with a Clear Center of Gravity This broad consistency of responses holds true down to the question level. On an average 7 of the 19 questions, more than 70 percent of company respondents will choose the same response. We don’t see that high a level of agreement on any question in the public data set. Of course, the real power of the Org DNA ProfilerSM data is what organizations do with it. Many clients have used it to great benefit to drive results. For instance, an outsourcing company based in India was worried that its organization could not accommodate its torrid growth. Frontline managers were being hired so rapidly, senior management assumed they would quickly burn out and become disgruntled. They administered the Org DNA ProfilerSM to every manager in the company and were stunned to discover that, if anything, junior managers had a brighter outlook than their bosses and felt the company was very healthy, indeed Resilient. In fact, it was the founding team of senior executives who were much less likely to report a healthy profile — the opposite of our general finding that senior management tend to be more optimistic about organizational health. As part of a full-day, facilitated offsite, the senior team explored this result, among others, and concluded that, as the entrepreneurs who founded the enterprise, their expectations for its performance were exceptionally high; they were less tolerant of perceived shortfalls. The company has since built its entire strategic plan as well as its implementation program around the four DNA building blocks, specifically targeting weaknesses identified in their Org DNA ProfilerSM results. A second client, a global health-care company, identified a number of organizational obstacles to optimal health using the Org DNA ProfilerSM, including unclear decision rights, a complex and overlayered management structure, and an insufficient emphasis on performance differentiation and accountability. They are now in the process of clarifying key decision rights, simplifying their management structure, and renewing the focus of the performance appraisal process on personal accountability for superior results. Another client, a not-for-profit global relief agency, used the Org DNA ProfilerSM to sample its staff in every corner of the world on their perceptions of the organization’s efficacy. More than 3,000 responses from all divisions and all levels within the agency revealed sharp distinctions. For example, North American respondents reported fewer healthier behaviors as a rule, and divisions responsible for delivering aid tended to report healthier traits than those focused on fundraising. The agency was able to use these findings immediately to design programs tailored to the different needs of its various regions and divisions. Moreover, it uncovered and is now exploiting opportunities for internal best-practices sharing. In addition to serving as a useful diagnostic tool, the Org DNA ProfilerSM is a springboard to action. It initiates a dialogue within organizations — among regions, divisions, management levels — that starts with a common understanding and leads to improved results. |
|
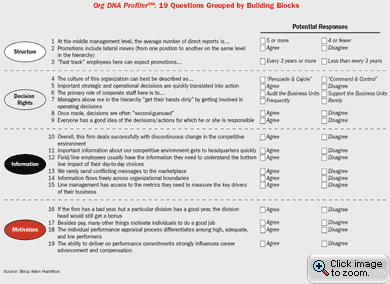
Research Methodology The Web site is open to the general public, and visitors can voluntarily complete a profile of their organization. In addition to answering the 19 questions, respondents also provide demographic information (e.g., their organization’s size and industry, their own level and department in the organization). We use these data to categorize responses and identify differences across industries, functions, management levels, and the like. When we create a custom Org DNA ProfilerSM for a client, we tailor the demographic questions to establish the comparison groups that are most relevant to that client’s situation (e.g., what division/location a respondent works in, whether he or she came from an acquired entity, etc.). On both the public site and the company-specific sites, individual responses are strictly anonymous: No names (company or individual) are requested or revealed. The data collected are used for analysis and comparison purposes only. Org DNA ProfilerSM: 19 Questions Grouped by Building Blocks Source: Org DNA ProfilerSM data collected from www.orgdna.com, based on 30,000 responses; Booz Allen analysis |
DeAnne M. Aguirre (aguirre_deanne@bah.com) is a senior vice president based in Booz Allen Hamilton’s San Francisco office. Focusing on helping companies implement organizational change, she works with clients primarily in the financial services, health services, and consumer products industries.
Lloyd W. Howell Jr. (howell_lloyd@bah.com) is a vice president with Booz Allen Hamilton in McLean, Va. An organizational change specialist, he works with both private- and public-sector clients, including the Internal Revenue Service, the Small Business Administration, the U.S. Air Force, and the U.S. Marine Corps.
David B. Kletter (kletter_david@bah.com) is a vice president with Booz Allen Hamilton in New York. He has helped drive major organizational change with both Fortune 500 and large government clients.
Gary L. Neilson (neilson_gary@bah.com) is a senior vice president with Booz Allen Hamilton in Chicago and coauthor, with Bruce A. Pasternack, of RESULTS: Keep What’s Good, Fix What’s Wrong, and Unlock Great Performance (Crown Business, 2005). He helps companies diagnose and solve problems associated with ineffective organization and strategy implementation.


