Money Isn’t Everything
Lavish R&D budgets don’t guarantee performance. A new Booz Allen Hamilton study of the world’s 1,000 biggest spenders reveals the value of an innovation dollar — and the basics of a better strategy.
 The quest for innovation has long been a faith-based initiative: Spend more, and profit will come. Are you losing out to nimbler competitors? On the high-cost end of globalization? Is your sales growth flattening? Are your margins narrowing? Want to prove to Wall Street you’re serious about growth? Don’t worry; just increase the R&D budget. New products or services will emerge that make the difference — won’t they?
Not so fast. The results of our recent study of the Booz Allen Hamilton Global Innovation 1000 — the 1,000 publicly held companies from around the world that spent the most on research and development in 2004 — may provoke a crisis of faith. The study, which we believe is the most comprehensive effort to date to assess the influence of R&D on corporate performance, suggests that nonmonetary factors may be the most important drivers of a company’s return on innovation investment (ROI2). The major findings:
Money doesn’t buy results. There is no relationship between R&D spending and the primary measures of economic or corporate success, such as growth, enterprise profitability, and shareholder return.
Size matters. Scale leads to advantage. Larger organizations can spend a smaller proportion of revenue on R&D than can smaller organizations, and take no discernible performance hit.
You can be too rich or too thin. Spending more does not necessarily help, but spending too little will hurt.
There isn’t clarity on how much is enough. Instead of clustering into any coherent pattern, R&D budget levels vary substantially, even within industries. This suggests that no single approach to spending money on innovation development is universally recognized as the most effective strategy.
It’s the process, not the pocketbook. Superior results, in most cases, seem to be a function of the quality of an organization’s innovation process — the bets it makes and how it pursues them — rather than the magnitude of its innovation spending.
Collaboration is key. The link between spending and performance tends to be strongest in those areas most under the control of the R&D silo, such as product design, and weakest in those areas where cross-functional collaboration is most difficult, such as commercialization.
These findings conjure up familiar images of frustration. Hardworking R&D teams invest time and money in the wrong projects; manufacturing, marketing, and sales drop the ball on winning products and services; and senior executives and policymakers simply throw more money at research and development in the mistaken belief that it will make a difference. When it comes to innovation investment, it appears that in many cases, less may be more.
Innovation’s New Context
The myth that higher R&D spend translates into competitive advantage has been around for decades, but it appears to be particularly strong now. Pick up any business magazine or newspaper. You’ll find ample evidence of the belief in the effectiveness of larger budgets, for both corporate and national competitiveness:
-
“U.S. spending on R&D will also have to increase if the country wants to remain technologically dominant.” —Fortune, July 2005
-
“We need at NEC to increase our R&D spending by as much as 50 percent to keep ahead of the competition.” —NEC Corporation (#41 on the list of 1000) senior vice president, quoted in The Age, July 2005
-
“The European Commission will today appeal to E.U. countries to increase spending on research and development, or face being out-paced by competitors such as China.” —Financial Times, July 2005
-
“[Yahoo] spends as heavily on product development and R&D as Google and Microsoft…falling behind in this arms race would spell big trouble.” —Fortune, August 2005
Perhaps this belief is a holdover from the past. When products were simpler, industrial processes less mature, and competition less fierce, companies could make new products and be reasonably certain that their customers would buy them. The R&D, manufacturing, marketing, and sales silos could do their jobs independently with little imperative to manage across departmental boundaries.
We no longer live in that world. Shorter product life cycles have led to an ever-faster flow of new offerings. Customer demands for special features have generated enormous complexity. In turn, these factors have increased the competitive value of a fast and effective innovation engine. Yet of all the core functions of most companies, innovation may be managed with the least consistency and discipline.
The comparison of R&D investment with economic performance provides a lens through which we can judge the innovation effectiveness of the Global Innovation 1000. Despite significant variation in innovation investment levels, the sheer magnitude of these companies’ spending leaves little doubt that they are committed to innovation. But the disconnect between R&D investment and performance levels demonstrates that commitment is no guarantee of success.
Happily, the analysis of top performers offers important clues on how to increase innovation effectiveness. It suggests that organizations — and nations, for that matter — hoping to gain an innovation edge will need to rely less on faith and more on creativity, analysis, and disciplined management.
A Thousand Top Spenders
In mid-2005, hoping to better understand how organizations can maximize their return on innovation investment, we undertook an analysis of the world’s top 1,000 corporate spenders on research and development. Since such an analytic undertaking demands a broad range of comparable data on R&D spending and financial performance over time, we focused on publicly traded corporations. The top 1,000 companies were ranked on the basis of the R&D spending reported in their 2004 financial statements. Consequently, the Global Innovation 1000 omits privately held firms, along with publicly traded firms that do not disclose their R&D spend. For this reason, most financial-services companies and retailers were excluded. (For more on the study, see “Booz Allen Hamilton Global Innovation 1000: Study Methodology,” below.)
The Global Innovation 1000 spent $384 billion on R&D in 2004, representing 6.5 percent per annum growth since 1999. And the pace is increasing — measured from 2002, the annual growth rate jumps to 11.0 percent. R&D spend appears to be highly concentrated. The top 2,000 corporate R&D spenders spent $410 billion — only $26 billion, or 6.8 percent, more than the Global Innovation 1000. We estimate that the Global Innovation 1000 list captures between 80 and 90 percent of total global corporate R&D spending, and around 60 percent of total global R&D, including that conducted by governments. (For a detailed look at the Global Innovation 1000, see “Profiling the Booz Allen Hamilton Global Innovation 1000,” below.)
|
Profiling the Booz Allen Hamilton Global Innovation 1000 |
|
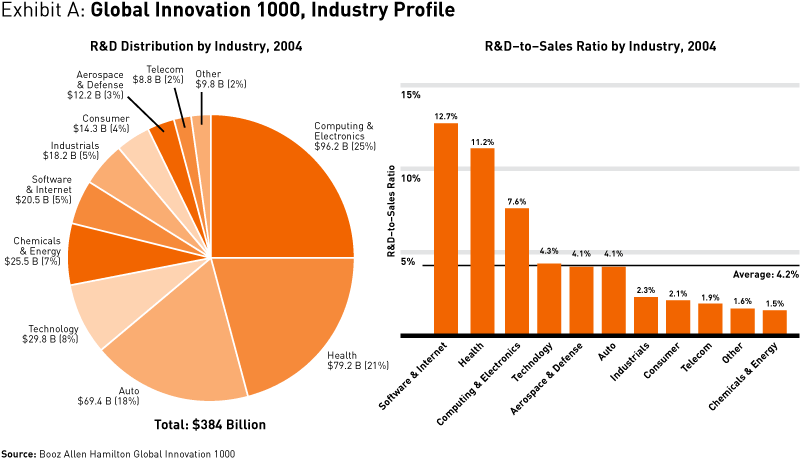
The Booz Allen Hamilton Global Innovation 1000 is a diverse yet exclusive club. Individual company research and development spending ranges from a high of nearly $8 billion (Microsoft, #1) to a low of $39 million (McCormick & Company, #1000). As that range suggests, the Global Innovation 1000’s R&D spending profile is highly concentrated, with the top 100 organizations accounting for 64 percent of the total outlay. On average, the Global 1000 companies spend 4.2 percent of their revenue on R&D. This average has been relatively stable over the last five years, ranging from 4.0 percent to 4.4 percent, and even more stable over the last three years, ranging from 4.2 percent to 4.4 percent. Industry Breakdowns
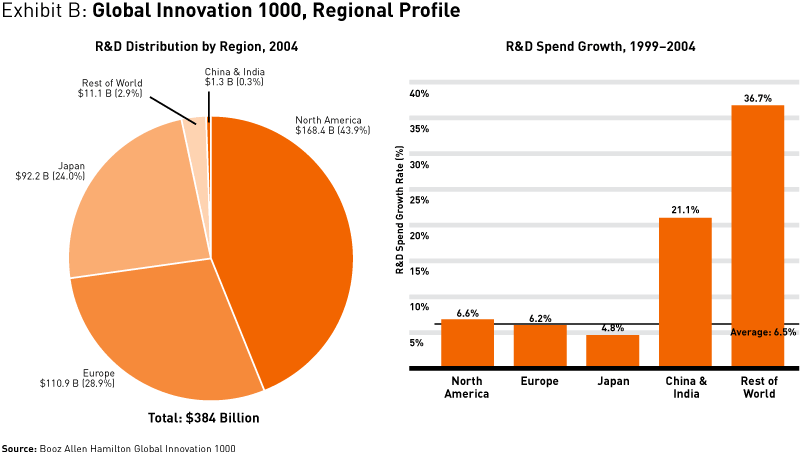
Software and Internet at 15.0 percent per annum and health at 12.4 percent have demonstrated the fastest pace of five-year R&D growth, while telecom (2.2 percent) and chemicals and energy (1.4 percent) have grown the slowest. The R&D-to-sales ratio — a measure that illustrates the importance of R&D to an industry or enterprise — shows huge variations. We see on average software and Internet (12.7 percent) and health (11.2 percent) outspending consumer (2.1 percent) and chemicals and energy (1.5 percent). Furthermore, we have seen the gap between high-spending industries and low-spending ones widen as R&D-to-sales ratios in both the software and Internet and health sectors have grown, while those for chemicals and industrials have declined. Regional Breakdowns We do, however, see some regional differences in the data. (See Exhibit B.) Although companies headquartered in North America, Europe, and Japan account for 96.8 percent of the Global Innovation 1000’s R&D spend and are likely to remain dominant players for the foreseeable future, companies from China, India, and the rest of the world are turning up the volume on R&D spend. (For more on this, see “China's Five Surprises,” by Edward Tse, s+b, Winter 2005.) The lower five-year growth rates in North America (6.6 percent), Europe (6.2 percent), and Japan (4.8 percent) are probably functions of the relative maturity of these companies and the magnitude of their current spending. The differences among the three main spending regions are partially explained by differences in industry mix, with lower-growth automotive and consumer electronics in Japan and higher-growth software and health in North America and Europe.
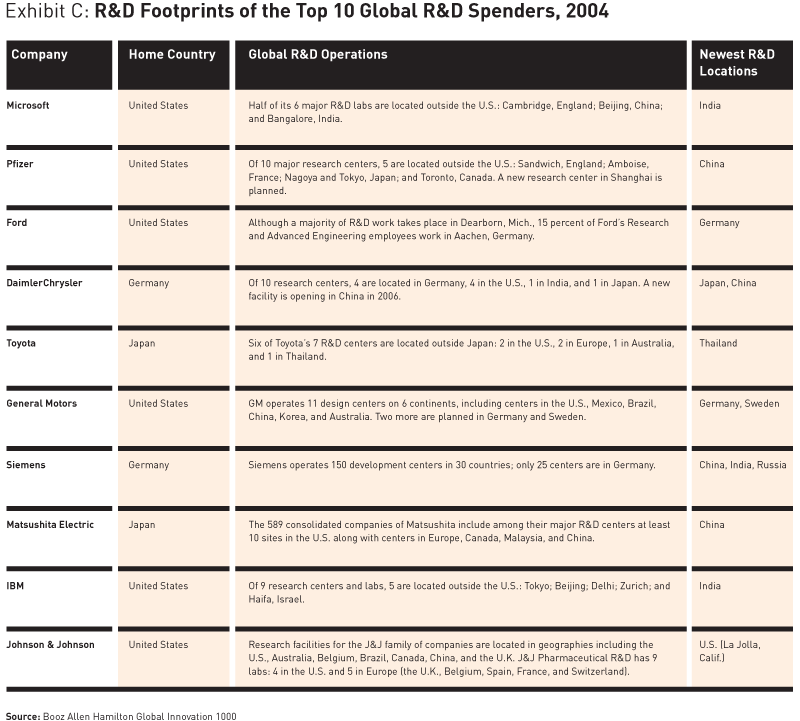
Regional disparities also exist on R&D-to-sales ratios. Here China and India lag, spending only 1.0 percent of company revenue on R&D, compared with 4.9 percent for North America, 4.0 percent for Europe, and 3.8 percent for Japan. One clear trend is the rapid expansion of worldwide investment in innovation. Large companies are increasingly targeting R&D away from headquarters and toward local markets and development partners. Although that trend is not necessarily reflected in publicly reported R&D numbers (which list companies according to their headquarters location), it is evident in the activities of the top-spending companies themselves. For example, only one of the top 10 R&D spenders has opened a new facility in the United States recently, and only two have opened facilities in Europe. (See Exhibit C.)
|
Money Doesn’t Buy Results
So what does this huge investment yield the Global Innovation 1000? Although there are individual success stories, we could find few statistical relationships between R&D spend and business results. There is no discernible relationship between spending levels and most measures of business success.
For our analysis we used the R&D-to-sales ratio — the percentage of an organization’s revenue that it spends on R&D — as the primary metric for spending. Although this measure has its limitations, it is commonly used and thus familiar and publicly available. It also enables comparisons that reveal the relative importance of innovation in different industry sectors (for example, pharmaceutical companies spend more per dollar of revenue on R&D than utilities do). This measure also eliminates any bias related to company size. For example, Intel (#12) spends 80 times as much as Cymer (#766), but both have an R&D-to-sales ratio of 14 percent; Ford (#3) spends 130 times as much as Nissin Kogyo (#790), but both have an R&D-to-sales ratio of 4.3 percent. Finally, the R&D-to-sales ratio can be indexed across industries to enable meaningful analysis of the Global Innovation 1000 as a whole.
Contrary to conventional assumptions, R&D spending levels within the Global Innovation 1000 had no apparent impact on sales growth, gross profit, operating profit, enterprise profit, market capitalization, or total shareholder return. Whether we looked at R&D as a leading or a lagging indicator, whether we looked at absolute dollar amounts or growth trends for the performance measures, and no matter what the time horizon for the analysis, the story was the same. (See Exhibit 1.)
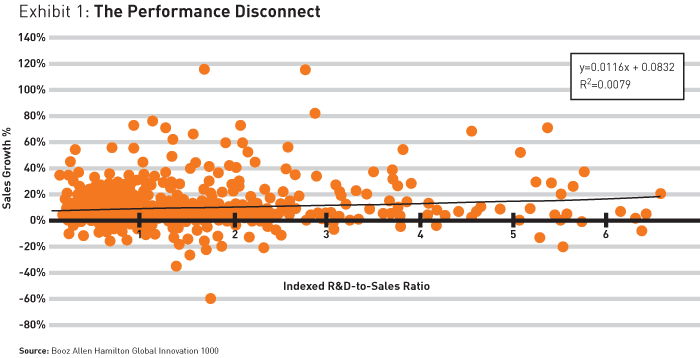
This scatter plot shows no correlation between our primary metric for R&D spending by the Global Innovation 1000 — the indexed R&D-to-sales ratio for 1999 (the x-axis), and sales growth during the following five years, from 1999 to 2004 (the y-axis). In 495 such analyses, similarly uncorrelated results for profitability growth, enterprise profitability (gross, operating, and net), market capitalization growth, and total shareholder return demonstrated that R&D spending has little or no impact on these indicators of success.
This is big news. It suggests that strategies that focus primarily on increasing the cash input to an innovation “black box” — a process presumed to transform R&D spending into results without anyone fully understanding how — are more likely than not to fail to deliver the desired performance.
It comes as no surprise, however, to our Booz Allen colleague Dr. Allan O. Steinhardt, a former chief scientist of the Defense Advanced Research Projects Agency, the R&D arm of the U.S. Department of Defense. He comments: “It’s absolutely a myth that money alone will solve vexing technical problems. Rather, reckless funding largesse is actually a barrier to transformative innovation as it turns scientists into constituents with an incentive to maintain the status quo. Reasonable constraints are a spur to progress. Entitlement programs for scientists and engineers are a drag.”
Better Mousetraps
We found only one strong performance correlation. Higher R&D-to-sales ratios were associated with higher gross margins: the percentage of revenue left over after subtracting the costs of materials, labor, manufacturing, and direct shipping, and after paying other expenses incurred in making the products or services sold.
This link between R&D spending and higher gross margins was evident in aggregate, where the median gross margins of the top 500 companies based on indexed R&D-to-sales ratios were 40 percent higher than those for the bottom 500. Out of 10 industries we assessed, while the amount of the performance boost varied from industry to industry, none showed a different pattern. (See Exhibit 2.)
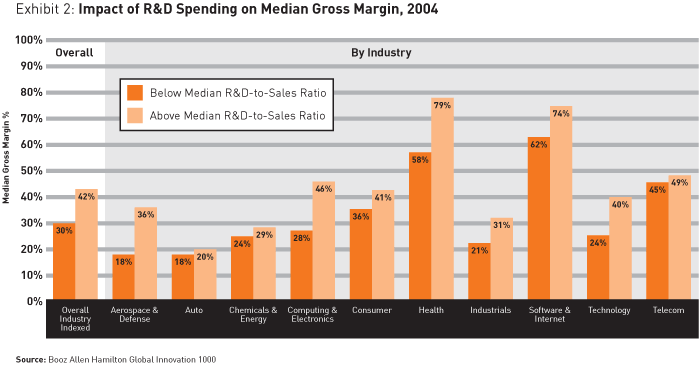
Gross margin percentage is an indicator of “better mousetraps”: product differentiation, low manufacturing cost, or both. Across the 2004 Global Innovation 1000, it was the only consistent financial benefit of a higher-than-median R&D-to-sales ratio. As shown here, higher-than-median spenders (the light bars) have a higher gross margin percentage than lower spenders (the dark bars).
Of all the performance measures we studied, gross margin percentage is most subject to the control of, and influenced by the skills of, the R&D silo. Researchers on innovation have long known that 70 percent of the final cost of a product (the cost reflected in gross margin) is driven by R&D-based design decisions, such as the degree of standardization of parts, the specifications that determine which suppliers will be used, and the level of complexity in a product’s feature set. In this study, the correlation of gross margin with R&D spending shows that the R&D silo is succeeding in the traditional but narrow role of making “better mousetraps”: products and services that are less expensive to build (like a Dell computer), desirable enough to sell at a premium (like a BMW car), or both (like an Apple iPod).
But these better mousetraps aren’t catching more mice. The products and services created have not universally led to improved enterprise performance. Once you add in all the expenses not directly related to the creation of the product or service — marketing, sales, and the rest of the general and administrative expenses — the gross margin benefit is masked and the relationship between spending and performance disappears.
The story of Sony (#14) and its Betamax videotape format is a classic example. Higher-quality Betamax lost to VHS primarily because more companies supported the latter format — a factor that had nothing to do with R&D spending per se. No doubt the Betamax recorders sold delivered an attractive gross margin, but not enough were sold to boost Sony’s results materially.
Particularly in the technology sector, the high quality of a product or service design may blind companies to the gaps in the rest of their system. In short, when a company is seeking to grow through innovation, it’s more important to develop a robust business model and good cross-functional capabilities than to boost the R&D budget. (For another example, see “Flying Blind,” by Nicholas G. Carr, s+b, Winter 2005.)
Size Matters
A lot has been written about the advantages of the nimble newcomer. Counter to popular belief, however, the data suggests that incumbency has a big advantage as well: scale.
Companies that are larger than median (on the basis of sales) tend to spend a smaller proportion of sales on R&D than do smaller-than-median ones. (See Exhibit 3.) In fact, the industry-indexed R&D-to-sales ratio for the Global Innovation 1000’s bottom 500 companies ranked on sales is 2.3 times that of the top 500 companies. On an industry basis, nine out of 10 of our industries showed this pattern. For example, consumer products companies with larger-than-median revenues are more than twice as likely to be in the lower half of companies ranked on R&D-to-sales ratios.
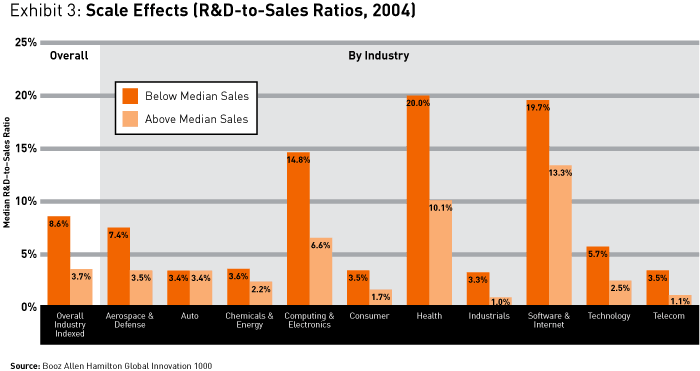
R&D-to-sales ratios show the proportion of revenue that a company devotes to innovation. In nine out of 10 industries, smaller companies (the dark bars) spent proportionally more on R&D in 2004 than did their larger competitors (the light bars). Such a pattern suggests the value of scale: To achieve the minimum innovation ante for their industry, smaller companies must devote a greater percentage of their revenue to R&D.
Although bigger companies tend to spend proportionally less, they are not penalized for their thrift. Their performance on such measures as sales growth, profitability, and market value growth is statistically indistinguishable from that of the smaller, relatively higher-spending firms.
Too Rich or Too Thin
If spending more doesn’t get you more, is it time to cut budgets? Maybe, but with great care. There are signs that both overspending and underspending may contribute to the performance disconnect in the Global Innovation 1000.
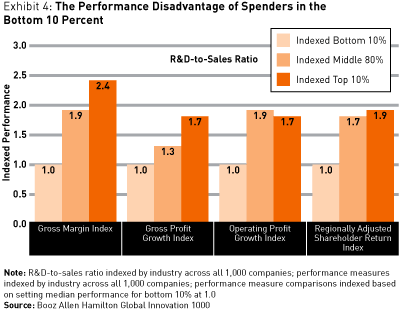
Companies in the bottom 10 percent of indexed R&D-to-sales ratios do worse than others. They underperform spenders in both the top 10 percent and the middle 80 percent on gross margins, gross profit, and shareholder returns. (See Exhibit 4.) But we found signs that the top 10 percent of the Global Innovation 1000 may be spending too lavishly as well. Although there are performance differences between the top 10 percent and the middle 80 percent, none are statistically significant.
These results offer one clear lesson: avoid being either a top or a bottom spender unless you have a clear and compelling rationale. Companies, for example, might overspend for a time to stake out a leadership position in a critical emerging technology; they might underspend for a time to concentrate scarce resources on a major product launch. Once these time-limited objectives are met, however, companies will generally be better off returning to a more moderate spending level.
Broader use of partnerships to share investment costs and spread risks can help bring spending levels down; so can being open to ideas that come from outside the corporation. (For example, the development and use of global and/or cross-company innovation networks — a practice known as open innovation — enables companies to access critical innovation capabilities and to pool resources to achieve virtual scale.) These approaches can help big spenders cut back, and can provide critical leverage to smaller firms seeking to overcome their innovation scale disadvantage.
We all can think of examples of once-great companies with a history of innovation and a culture of R&D that have little to show for their above-average investment in R&D. The Palo Alto Research Center at Xerox (#101), Xerox PARC, was fabled for its breakthrough innovations, but few ever benefited Xerox’s shareholders. Its most famous invention, the graphical user interface, was commercialized first by Apple (#148) and then by Microsoft (#1). Its invention of the Ethernet protocol for computer communications was a boon to 3Com (#527). Likewise, Bell Labs was a national asset. In the early 1980s, just prior to the court-ordered breakup of its parent company, AT&T, it spent $2 billion a year on R&D. During its 80-year history, Bell Labs scientists created the transistor, the communications satellite, the laser, and Unix — yet firms other than Ma Bell reaped the primary economic benefit of these inventions.
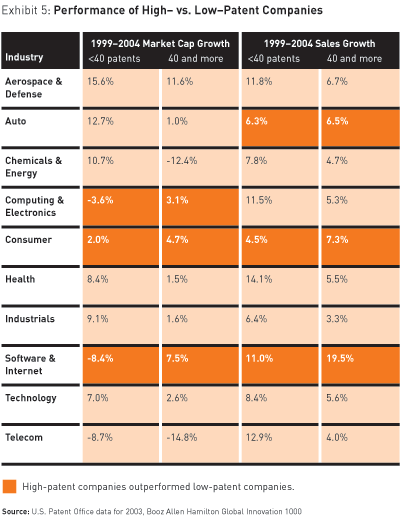
These findings seem to suggest that at any given time there’s only so much research that a company can nurture and commercialize. Beyond that, the company provides a public service — valuable to society perhaps, but not to its shareholders. These findings also help explain why in a separate study we found no relationship between the number of patents issued to an organization and its business results. (See Exhibit 5.)
How Much Is Enough?
Optimizing innovation spending is difficult, but it is essential to achieving an attractive ROI2. The data demonstrates the difficulty. Were there clear industry norms for R&D spend — a sense of “what worked” — we would expect R&D spend for any industry, over time, to cluster around some mean. None of the Global Innovation 1000 industries show this pattern, suggesting that even the largest R&D spenders are struggling to find their ideal investment level.
Perhaps when executives have greater insight into the real drivers of innovation performance, we will start to see a clearer pattern. For example, as marketing analytics have become more sophisticated, marketing budgets have increasingly gravitated toward an optimal level. The same may ultimately happen for R&D and innovation budgets, but there’s no sign of it to date.
Processes, Not Pocketbooks
The potential overspending identified in this study resonates with prior research by Booz Allen Hamilton Vice President Alexander Kandybin (“Raising Your Return on Innovation Investment,” s+b, Summer 2004) demonstrating that financial returns on innovation investment depend on the effectiveness of innovation processes: the way a company generates, selects, develops, and commercializes ideas. The innovation effectiveness at Toyota (#5) is a benchmark for competitors, yet Toyota is only the third-highest spender in the auto industry. The company’s focus on product and process excellence has resulted in the shortest development cycle time in the industry, the leadership position in hybrid technology, and a market value (in October 2005) greater than that of the next three largest vehicle manufacturers (ranked by market capitalization) combined ($167 billion versus $160 billion).
At the spending levels represented by the Global Innovation 1000, companies can maximize their return on innovation investment through better processes for ideation, project selection, development, and commercialization. The imperative, then, is to identify the priority areas where process improvements will raise the curve the most.
For Apple in 1996, the issue was portfolio management. After Steve Jobs was reinstated as CEO, he led a massive review of the R&D effort. As a result, Apple cut a large percentage of projects, focused its development resources on the short list of those that had the greatest potential, and started an innovation machine that eventually produced the iMac, iBook, iPod, and iTunes. This record re-earned Apple a reputation as one of the world’s most innovative companies. Yet it had achieved these results by brains rather than budgets. Apple’s 2004 R&D-to-sales ratio of 5.9 percent trails the computer industry average of 7.6 percent, and it was consistently below average in the years we studied (1999 through 2004). Furthermore, the $489 million Apple puts into R&D is not even one-tenth the amount spent by IBM (#9), the top R&D spender in computing and electronics. (This study covers the period before IBM sold its personal computer business to Lenovo.)
Collaboration Is Key
Successful innovation requires an exceptional level of cross-functional cooperation among R&D, marketing, sales, service, and manufacturing. And collaboration failures can have a devastating impact on the success of the innovation process:
• Ideation. Customer insights from marketing, sales, and service teams are essential to identifying attractive opportunities for new products and services.
• Project Selection. Generated by marketing staff, robust estimates of sales and profit potential make it possible for the R&D team to place educated bets on the projects with value propositions most likely to gain marketplace success.
• Development. The marketing team can also provide a deep understanding of customer needs, while manufacturing and suppliers can offer critical suggestions on design for manufacturability and better leverage of resources.
• Commercialization. The product or service can succeed only if all functions — R&D, marketing, manufacturing, sales, and service — are integrated as a team and each function is doing its part to support the value proposition through a seamless launch.
So what’s an organization to do? Based on in-depth observations of real-world innovation practice and our analysis of the Booz Allen Global Innovation 1000, we find that effective innovators do four things well:
1. Align innovation strategy with corporate strategy. It is surprising how often this alignment does not take place. When it does, it gives all functional silos an incentive to support the corporate strategy.
2. Make the right bets. This imperative requires managing not only the portfolio of projects and technologies that will maximize tomorrow’s profits, but also the portfolio of business models the company fields to bring these products or services to market. Any choice of a project to “greenlight” should be evaluated in the context of both customer needs and development costs.
3. Manage the pipeline with speed and efficiency. It is critical to have clear processes both to manage the innovation effort (e.g., program management standards) and to support it (e.g., knowledge management).
4. Recombine your “organizational DNA” to drive results. An organization’s DNA, as defined by a body of recent research at Booz Allen Hamilton and elsewhere, includes its structures and systems, and the degree of alignment of these elements with strategy. Companies should ask themselves: Are incentives in place to reward desired performance? Are governance and decision-making protocols clear and consistent? Does the structure of reporting relationships enable streamlined processes and support the company’s strategy? And are there clear channels for sharing knowledge about innovation and productivity?
As a result of their choices on these dimensions, different organizations have different organizational DNA profiles. There is a clear link between a corporation’s organizational DNA profile and its performance results from innovation: Organizations with healthy profiles significantly outperformed those with dysfunctional ones.
Within the Global Innovation 1000, companies that performed consistently well on at least six of the seven indexed performance measures we studied tended to have practices in place consistent with the four steps outlined above.
John Deere (#44), for example, delivered superior results by (1) aligning its strategy and incentives across all functions using shareholder value added (SVA, a set of cascading metrics and incentives used by Deere executives to tie decision-making behavior to the drivers of shareholder value), (2) enhancing portfolio planning by including customers and suppliers throughout the planning and design process, and (3) improving speed and decreasing product costs through the adoption of lean techniques. CEO Robert Lane, in a speech at the Kellogg School of Management in April 2003, commented on the value of listening to customers: “Too often we were leading customers, providing them with products and features they didn’t want to pay for.… It was an expensive way to conduct business.”
Samsung (#17), another top performer, has moved from innovation also-ran to leader in the last decade. Samsung’s executives are careful with the bets they make, entering only markets in which they have a chance to become dominant — and they are just as rigorous in managing their project portfolio. Organizationally, because they saw design as a major differentiator, they added a chief design officer to ensure that designers and engineers work together to deliver what the customer wants. And Samsung manages its pipeline with great efficiency: For example, from 2000 to 2002, the company increased its number of new product introductions by 67 percent (to 30,000) without increasing the number of parts required.
Beyond Conventional Wisdom
These companies, and similar top performers, recognize that the stakes are too high to leave results purely to chance. For others, the findings of the Booz Allen Hamilton Global Innovation 1000 should be a wake-up call. Investments in R&D may lead to prestige, or may have other benefits, but for most corporations, the primary benefit must be to shareholders. Regulated monopolies can sometimes justify excess innovation investment as part of their implicit or explicit bargain with government overseers, as AT&T did with Bell Labs. Such organizations are creating a national benefit, for example, increasing the pool of technically trained people or building out strategically important infrastructure that can lead to investment, jobs, and a sharpening of the nation’s competitive edge.
But for corporations competing in the free market, excess or ineffective spending is a drain on shareholder returns that saps the resources available for future innovation. Leaders of those companies should ask themselves the question, Are we focusing on the right projects and pursuing them with adequate resources and admirable efficiency?
As Larry Huston, the vice president of innovation and knowledge at Procter & Gamble (#51), noted in 2003 in Business 2.0: “A lot of R&D in America is not sustainable.… The rate of increase of R&D spending is going up faster than the rate of increase in sales.”
For policymakers, the Global Innovation 1000 findings raise different questions. If R&D spending is no guarantee of competitiveness, what metrics provide the best guide to future success? Is there an effective role for government in promoting innovation best practices?
From any perspective, the conventional wisdom has been exposed as false. There is no easy way to achieve sustained innovation success — you can’t spend your way to prosperity. If you’re a corporate leader, it’s time to roll up your sleeves, open the innovation black box, and start retooling the works. The future viability of your enterprise depends on it.![]()
|
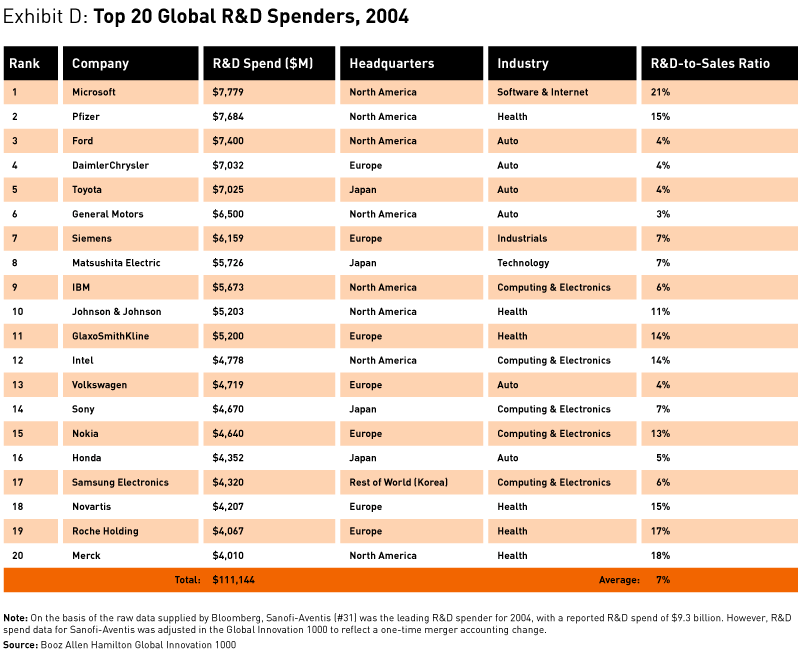
Top 20 R&D Spenders, 2004 |
|
Representing $111 billion, or 28 percent of total Global Innovation 1000 R&D spend, the Top 20 companies are largely North American and European. Four are Japanese, and one, Samsung, is Korean. The Top 20 have an average R&D-to-sales ratio (7 percent) nearly twice that of the next 980 companies (3.6 percent). This difference is driven primarily by the prevalence of computing and health firms in the Top 20.
|
|
Booz Allen Hamilton Global Innovation 1000: Study Methodology |
|
Booz Allen Hamilton identified the 1,000 public companies around the world for which data on R&D spending was publicly available that spent the most on R&D in 2004. Companies with noncalendar fiscal years were coded as 2004 when (1) their fiscal years ended before June 2005, and (2) their FY2005 results were available; otherwise, their 2004 fiscal year results were used. We then obtained a variety of financial metrics for the Global Innovation 1000 going back six years: revenue, gross profit, SG&A (selling, general, and administrative) expenses, operating profit, net profit, capital expenditures, and historical R&D spending. We also added six years of shareholder value measures to the data set, including total shareholder return (TSR) and market value. Each company was coded into one of 10 industry sectors (or “other”) according to Bloomberg’s industry designations, and into six country or regional designations according to reported headquarters locations for each company. This approach means that, for example, Chrysler’s R&D, though largely conducted in the United States, is reported to be in Europe given that DaimlerChrysler (#4) is headquartered in Germany and our practice is not to include consolidated subsidiaries in our rankings. This was the best possible approach, since R&D spending is only rarely broken out by subsidiary or region in corporate financial statements. To enable meaningful comparisons across industries on R&D spending levels, we indexed the R&D spending level for each industry against the median R&D spending level for that industry. Similarly, to avoid having the shareholder returns analysis be skewed by differences in performance across regional stock markets, we adjusted shareholder returns data to show each corporation’s performance relative to that of a leading index of its regional market. (All data on R&D spending and financial metrics came from Bloomberg’s data bank of publicly filed financial statements; shareholder-related measures came from Datastream.) |
Reprint No. 05406
Barry Jaruzelski (jaruzelski_barry@bah.com) is a vice president with Booz Allen Hamilton in New York. He concentrates on corporate strategy, organizational transformation, and time-to-market improvement for companies in high-technology industries and manufacturers of highly engineered products.
Kevin Dehoff (dehoff_kevin@bah.com), a vice president with Booz Allen Hamilton in New York, is the global leader of the firm’s innovation service offering. He has spent more than 13 years helping clients improve efficiency and effectiveness in product development.
Rakesh Bordia (bordia_rakesh@bah.com) is a senior associate with Booz Allen Hamilton in New York. He specializes in improving innovation effectiveness and efficiency for clients in engineered products industries.
The authors thank Matthew Clark and Alexander Kandybin for their contributions to this article.