
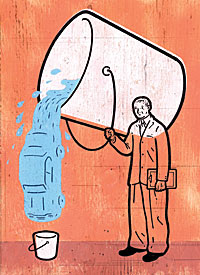
The Advertising Saturation Point
For every automobile, and maybe every product, there’s a threshold beyond which your ad budget is wasted.
 |
|
Illustration © 2005 Dan Page |
But what if there was an optimal level of advertising spend for any given product — beyond which the money was completely wasted? Economists often speak of “price elasticity”: When prices rise or fall, consumers respond by changing their purchase strategies. That is why price increases do not automatically lead to equivalent rises in revenues. The same kind of elasticity exists with advertising. For any given brand in any given market, there is a saturation point for advertising spend. Up to that point, increases in the ad budget will generate results; but once the market for a product or service is saturated, no matter how much a company spends on advertising, it will not produce enough added sales to justify the cost. The best possible budget places just enough ads to reach the saturation point, and not a dollar’s worth of advertising more. Companies that follow this principle will optimize their overall profitability because they will spend on advertising only what they can recoup in revenues.
Advertising saturation points may not be identifiable for every type of product, but they are consistently apparent in one of the primary worldwide categories for consumer advertising: the motor vehicle industry. Every automobile brand — such as Ford, Chevrolet, Toyota, or Fiat — has its own unique optimal saturation point. Each can be predicted in advance, before a budget is set, and thus can be used in planning advertising spend strategies. A saturation point represents optimal advertising in terms of profits. Once it is established, the saturation point becomes a key criterion by which an advertising budget can be judged.
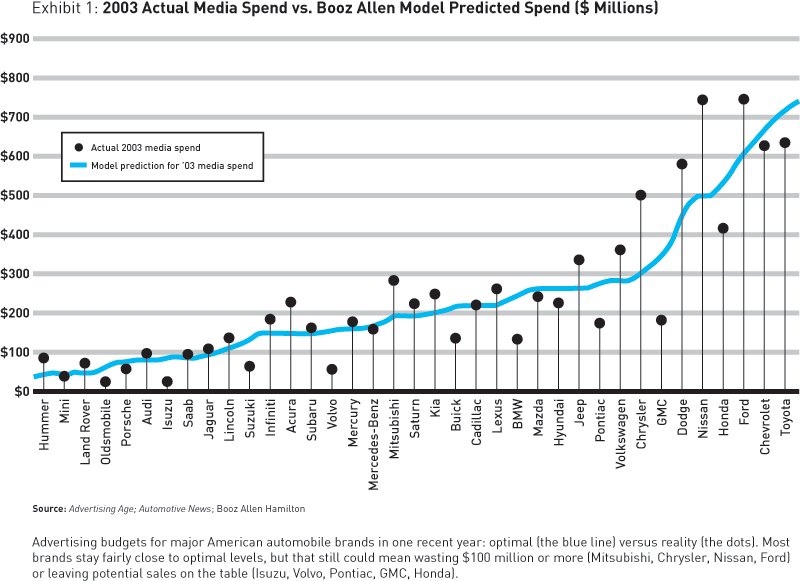
In 2004, in an in-depth Booz Allen Hamilton research study, we charted the pattern of media spend in the United States — on television, on radio, in newspapers, and in magazines — for all automobile brands sold between 1998 and 2004. We then estimated the saturation point for any given brand, using a statistical model based on an analysis of the three key factors that consistently seem to correlate with advertising spend:
1. The number of vehicle nameplates supported by a brand (excluding any niche vehicles, such as the Honda S2000, that represent only a tiny fraction of a brand’s volume). In general, a brand like Chevrolet or Ford, with 15 major vehicles produced in any given year, requires a larger budget than a brand like Saturn or Lexus, with only a handful of nameplates. (Nameplates is another word for automobile models, the individual vehicles released under a manufacturer’s “make” or “brand.”)
2. The number of nameplates launched or refreshed per year. For each major launch and each redesign and relaunch (which typically occurs every four or five years), manufacturers generally introduce a significant marketing campaign, and a higher level of ad spend is needed.
3. The brand’s market share (excluding nonretail sales, such as sales to rental car fleets, which require no advertising). As the total number of vehicles rises, two things happen: More is spent overall on advertising to support the brand, and less is spent per unit. Thus, with an increase in market share, the optimal advertising budget increases and the rate of increase slows down.
Our saturation point model has been consistently robust in predicting ad spending by brand and, we believe, in estimating advertising saturation points. The model explains 85 percent or more of the differences among automobile brands’ actual advertising budgets, and it helps to identify, in the remaining 15 percent, whether the automobile company is overspending or underspending. (See Exhibit 1.) The three variables highlighted by the model — the number of nameplates supported by the brand, the number of nameplates launched or refreshed, and the market share — are thus the primary factors worth considering in planning ad budgets. Other factors, such as creative quality and media mix, often occupy discussions about advertising that are disproportionate to their actual influence. They should be secondary considerations, at best, when an automobile company is strategically setting the targets for advertising spend.
The Automaker’s Dilemma
Several billion dollars’ worth of discretionary advertising budgets, and conceivably the health of the auto industry, are at stake. Automobile manufacturers, dealers, and component makers typically account for more than 25 percent of the total amount spent overall on advertising in any given year in the U.S., more than any other single business category, including packaged goods. And the amount of money the industry spends has steadily grown at least 14 percent each year, from $700 million in 1985 to nearly $11 billion in 2005 — almost a 15-fold increase.
Why so much? First, advertising prices in major media have risen about 7 to 8 percent per year, driven by mainstream broadcasters who, so far at least, have been able to compensate for the revenues lost to cable programming and the Internet by raising their own rates. Second, with an oversupply of automobiles on the market, many motor vehicle manufacturers have stepped up their advertising to try to take market share from their competitors. If this trend continues, a car manufacturer might spend 10 times as much in 2007 as it did in 2000 to advertise a similar lineup of vehicles.
The understandable concern among auto executives is evident not just in conversation, but in the growing number of trade magazine articles (more than 3,000 in 2003, a sixfold increase over 1995) mentioning the cost of advertising. Coming at a time of intense pressure to cut costs and improve profitability, the general increase in advertising spend has led motor vehicle company leaders to examine their advertising budgets more closely. But they face the challenge of finding an objective standard by which to evaluate those budgets. How much is enough?
Automobile advertising represents a rich venue for research. Not only are there a lot of car ads, but they are tracked in a relatively transparent manner. Twice each year, the trade magazine Advertising Age publishes competitive research statistics showing media expenditures for each major vehicle brand (Toyota, Chevrolet, Lincoln, Volkswagen, etc.), broken down by category of spend. These statistics cover all advertising placed by manufacturers alone. (These are largely generic ads: “Buy this car.”) They also include ads placed by manufacturers in association with dealers. (These ads typically focus on particular sales events: “Buy this car on sale now.”) The Ad Age statistics specifically exclude ads placed just by dealers (“Buy this car here”), which makes the statistics even more useful for evaluating manufacturers’ budgets.
The advertising saturation point is also easier to discern for an automobile brand than it would be for many other consumer product brands, because the cost of purchase is so great. Automobiles are not like beer or cereal; customers don’t buy them on impulse. Though automakers try to distinguish brands with lifestyle ads and emotional imagery, customers make their purchase decisions with a relatively high level of rationality. They decide what kind of car they need, and then choose a brand on the basis of their own experience with the vehicles, the experience of people they know, and the reports of a few trusted guides (like Consumer Reports or J.D. Power and Associates). Switching from one car brand to another is a bigger deal than switching soap brands; thus it’s easier to correlate changes in market share with changes in advertising spend patterns.
Nonetheless, past advertising budgets in the motor vehicle industry have not been set strategically. Chief executive officers, chief financial officers, and other decision makers in auto companies give a great deal of time and thought to setting the price points for their vehicles. They build in-depth analytic models, running multiple scenarios for each product line, vehicle configuration, and promotion, before making a decision. Not so for advertising spend. These same executives, when considering their advertising budgets, might typically ask only, “How much did we spend last year? What do we think our competitors will do next year? How much out of each car’s retail price do we put into advertising this year?” If times are tight, they might cut $100 million from the overall budget; in flush years, they might put back $50 million or start a new campaign.
In short, managers often base their ad spending on what they think they can afford, and on their perceived need to outspend the competition, rather than on the amount needed to produce maximum market share. Hence the dilemma they feel: To keep up with their competitors, they believe they have to spend more simply to remain in the same place.
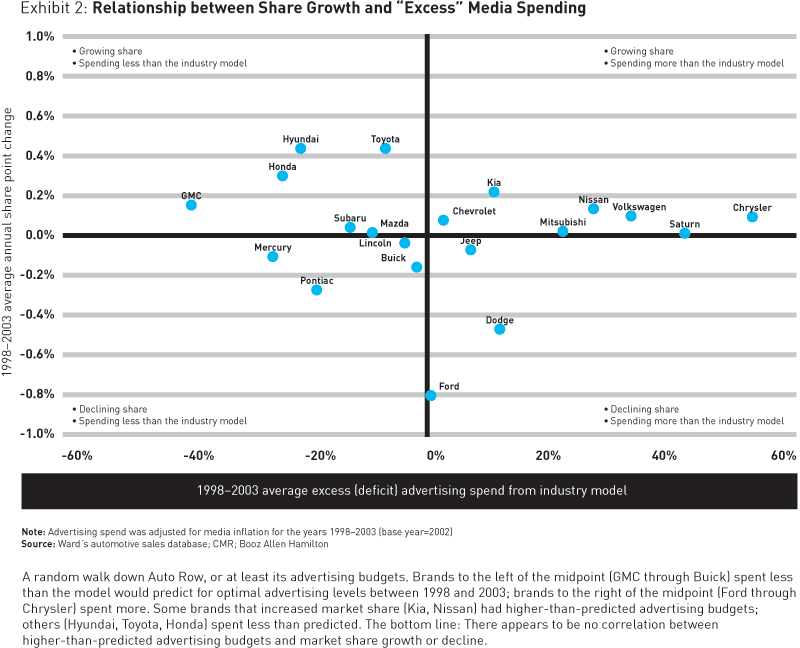
Yet there is no guarantee that auto brands that spend more than their competitors will increase their customer base. During the six years we studied, 1998 through 2003, many brands with “excess” media spending did indeed grow on average in market share. But so did some of their counterparts with less spending. For example, Ford and Chevrolet both spent close to the predicted optimum levels for their brands, but with widely divergent results. The same is true for Dodge and Kia, Lincoln and Toyota, and Pontiac and Hyundai. The two factors — market share change and media spend levels in excess of the prediction by the model — did not directly correlate. (See Exhibit 2.)
Trials and Errors
How, then, can an automaker (or other manufacturer) identify the “optimal” advertising spend level for its products? At first glance, it should be simple. Just continue to increase the advertising budget as long as the margin from incremental new sales is greater than the incremental costs. In the auto industry, for example, if another $10,000 in advertising spend leads to sales of 100 more vehicles, and if the incremental profit from each of those vehicles averages more than $100, then you can credit your company with a worthwhile advertising increase.
But many factors influence sales levels, including competitors’ strategies. To analyze those factors with enough accuracy to design an advertising campaign effectively, you would need to conduct a series of experiments: varying both the amount spent on advertising and the mix of advertising media from one region to the next, and measuring the resulting impact on sales. This in turn would require a disciplined scientific approach. Retailers, distributors, ad agencies, and other local associates would have to sign up as willing partners in both the experimental groups (with heavier advertising) and the control groups (with lighter advertising), even if that meant inequitable marketing support and diminished revenues in the short run. Even with these controls, the experiments would need to be conducted many times to negate the potential impact of varying creative quality. These kinds of difficulties have generally precluded the adoption of well-defined experiments to accurately measure the marginal impact of advertising.
Instead, in practice, companies take a “trial and error” approach. Each change in ad spending is essentially the start of an informal experiment. When sales figures come back, the results of the experiment are known. Since ad spending levels change whenever products are launched or new dealer association campaigns begin, most brands provide their executives with a large base of informal experiments with which to build their judgment. The feedback cycle is fast, which also improves the quality of judgment. As the head of marketing at one major auto manufacturer told us, “It varies by vehicle, but I often know in a week or two whether I’ve got my ad spending levels wrong.”
Since rival carmakers watch one another and tend to match one another’s budgets, there is also a second feedback process at work; they learn not only from their own collective experiments, but from those of their competitors as well. Over time, carmakers build an innate, shared sensibility that reflects the accumulated results of hundreds of ad hoc experiments. This becomes the conventional wisdom of the company, and in many cases of the industry. Thus, most brands move gradually to an optimal level of advertising spend that is very close to the saturation point predicted by our model.
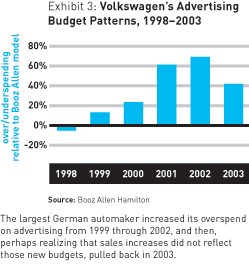 For example, beginning in the late 1990s, Volkswagen deliberately increased its advertising presence in the United States. This was part of Volkswagen’s effort to reposition its brand to leverage European styling, the promise of Japanese quality, and “friendlier” new nameplates (such as the new Golf and Beetle). The Gunn Report for Media gave Volkswagen its annual “World’s Most Creative Advertiser” award four times between 1999 and 2004. From the perspective of the model, however, and from the perspective of the rest of the industry, VW’s ad spend levels were disproportionately high. Since 2003, its spending levels have begun to moderate, although they are still high compared with the predictions of the saturation point model. (See Exhibit 3.) This is presumably because Volkswagen is discovering that its spending levels are not yielding commensurate sales and profitability. If that trend continues, we’d expect VW’s spending levels to trend back toward its saturation point.
But there are limits to the “trial and error” approach. It takes time to conduct all those experiments and develop the requisite awareness, especially for a new brand or a relaunch like Volkswagen’s New Beetle. During that period of experimentation, money may be wasted. Moreover, intuition isn’t quantitative. Many marketers, lacking proof that their own gut preference is correct, try to corroborate and justify it by benchmarking. They track their own media spending figures against those of competitors. But such exercises seldom lead to the validation desired, because there is an extremely wide range of media spend levels. Simplistic measures, such as ad spending per vehicle, can be uninformative and even misleading. Among mass-market automobile brands, media spending in 2003 ranged from $181 per vehicle at Ford to $1,612 per vehicle — nearly nine times as much — at Mitsubishi. Finally, when conditions change, another type of advertising spend strategy may be called for, and conventional wisdom is often slow to change.
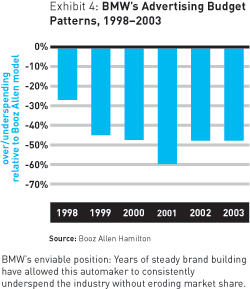 A model like ours can make advertising decisions more resilient by bringing out into the open the otherwise hidden interrelationships that affect the advertising saturation point for any given brand. For example, BMW has an enviably small — yet sensible — advertising budget because of two relatively obscure factors: its small number of models in production and its distinctive and long-lasting brand identity. The strength of its brand has given it a small but loyal market base, and its advertising message has been consistent over time. The “Ultimate Driving Machine’’ slogan has appeared constantly since it was conceived in the mid-1970s. BMW has consistently spent less on advertising than the industry at large, because advertising isn’t needed to maintain its market share. (See Exhibit 4.)
Broadening the Scope
The saturation point model turns out to predict effective ad spending levels fairly well in the automobile category. But how well does it apply to other categories? The answer is still unknown. For many consumer products, such as cosmetics and food, advertising costs represent a much higher percentage of the ultimate price than is the case for automobiles. A can of soda is typically purchased on impulse. Its gross margin is minuscule compared with the margin on an automobile. And its saturation point can be affected by the popularity of the category as a whole, as we have recently seen with diminishing cola sales.
The model also does not reflect the impact of alternative forms of media, such as the Internet, on advertising. For automobiles, two-thirds of the advertising spend is still placed on broadcast or cable television. That may change during the next few years.
Nonetheless, it may be possible to calculate advertising saturation points for most consumer products, even in a changing media environment. To make those calculations, we need to articulate tangible answers to questions like these: How risky is it for the consumer to try the product? How much margin does the manufacturer make for each incremental unit sold? How easy is it to lure customers from a competitor? How much influence does advertising have for this category compared with others? Though these seem like generic questions, they can all be modeled if the sales and advertising spend data is available — as it almost always is.
Perhaps the most surprising conclusion from the automobile study was the rationality of underlying behavior. Over time, most companies optimize their way to the best possible level of advertising spend. As economists know very well, this is standard observable behavior in pricing. Those who charge too much lose market share; those who charge too little find themselves unable to sustain their offerings. Given a reasonable amount of time and freedom from regulatory constraint, prices gravitate toward an optimal equilibrium.
We believe the same thing happens in advertising. The cycle time is longer than it is with pricing, but the end result is the same. Those who recognize this first, and learn to keep predicting their saturation point amid a changing market environment, will keep one step ahead of the ad spend strategies of their competitors.![]()
Reprint No. 05307
Evan Hirsh (hirsh_evan@bah.com) is a vice president of Booz Allen Hamilton based in Cleveland. He specializes in strategic marketing, business unit strategy, and performance improvement for consumer and industrial companies. Mr. Hirsh is coauthor, with Steven Wheeler, of Channel Champions: How Leading Companies Build New Strategies to Serve Customers (strategy+business/Jossey-Bass, 1999).
Mark Schweizer (schweizer_mark@bah.com) is a principal in Booz Allen Hamilton’s Cleveland office. He focuses on product, sales, and marketing strategy for manufacturers and distributors of highly engineered goods, with particular emphasis on automotive OEMs and suppliers.