CEO Succession 2002: Deliver or Depart
Performance-related dismissals are up and board tolerance is down at large companies around the world, the annual Booz Allen Hamilton study finds.
With the industrialized economies enduring their third straight year of sluggish growth and bear markets, business has seemed more the subject of Greek tragedy than the center of the global economy. Like Oedipus, some chief executives were overcome by hubris, then humbled by scandal; consider Tyco International Ltd. Chairman, CEO, and President L. Dennis Kozlowski — indicted for tax fraud — or Tokyo Electric Power CEO Nobuya Minami, who resigned after a power-plant inspection controversy. Other CEOs, Icarus-like, flew too close to the sun of the public’s attention, only to fall to earth when their ambitions melted — think Jean-Marie Messier of Vivendi or Bertelsmann’s Thomas Middelhoff. Playing the Furies: shareholders, outraged by the perceptions of excess, and demanding change.
Alas, this drama, which is playing out around the world, is not mythological, not episodic, and not going away. According to our annual study of CEO succession at the world’s largest companies, the forced turnover of chief executive officers of major corporations because of deficiencies in their performance reached a new high in 2002, rising a staggering 70 percent over 2001. The phenomenon is increasingly global in scope: In the Asia/Pacific region, where CEOs of major corporations had been relatively protected from market forces, involuntary succession has now reached levels equivalent to those in other regions.
The conclusion is inescapable: Forced CEO succession has become the “new normal.” Boards of directors are now exercising their power on behalf of shareholders with almost unprecedented vigor. Indeed, the increasing pace of performance-related CEO turnover shows that aggressive shareholder capitalism has become the defining characteristic of business in the 21st century, as significant an attribute as managerial capitalism was in the 20th century.
Because regulators and the media currently are fixated on “bad behavior,” boards have concentrated on ensuring the accuracy of financial information and removing poorly performing CEOs. Inevitably, the pendulum of public pressure will swing from correction to perfection, with shareholders’ representatives focusing on how to improve CEO selection and performance. Anticipating this shift, we expanded our survey this year to include demographic and situational variables in an effort to identify correlates of CEO success.
Among the specific conclusions from our second annual study of CEO succession at the world’s 2,500 largest publicly traded companies, we found:
• Involuntary, performance-related turnover reached a record high in 2002 , accounting for 39 percent of all successions, up significantly from 2001, when forced turnover accounted for one-quarter of all events.
• The rest of the world is evolving toward U.S.-style deliver-or-depart leadership. CEO succession events are up 192 percent in Europe and 140 percent in the Asia/Pacific region since 1995, our study’s benchmark year; in North America, where frequent turnover at the top has been the norm, succession events increased 2 percent during the same period. In the Asia/Pacific region, which had been relatively immune to forced succession, involuntary departures accounted for 45 percent of all turnover last year.
• Boards are judging CEO underperformance more strictly. Chief executives who were dismissed in 2002 had generated median shareholder returns 6.2 percentage points lower than those generated by CEOs who retired voluntarily. In 2001, it took an 11.9 point shortfall to prompt a firing; in 2000, fired CEOs underperformed retiring chiefs by 13.5 points.
• Merger-driven transitions declined considerably in 2002 even as forced successions rose , indicating that CEOs face increased pressure to grow their businesses organically. Merger-related successions made up 15 percent of all CEO turnover globally, down from 27 percent the previous year and 29 percent in 2000.
• The only “safe” industry for CEOs is financial services. Telecommunications firms experienced by far the highest rate of forced CEO turnover in 2002. Financial services, industrials, and consumer staples continued to enjoy exceptionally low turnover rates last year.
• CEOs appointed from outside the company are a high-stakes gamble. Outsiders excel early, delivering returns to shareholders nearly 7 percentage points greater than insiders in the first half of their tenures. In the “second semester,” when all CEOs endure a slump, outsiders lag insiders by 5.5 percentage points. Outside hires are also far more likely to be fired than insider appointees.
Shareholders Rule
Booz Allen Hamilton has been studying CEO succession at the world’s largest companies to identify patterns in the relationship between chief executive tenure and corporate performance that might be relevant to the way CEOs and boards lead companies. Following the methodology established last year, we identified chief executives at the 2,500 largest publicly traded companies in the world (based on the companies’ market capitalization on January 1, 2002) who left their positions in 2002. Using the companies’ public statements, as well as our review of press coverage, we determined whether a retirement was voluntary or induced. We used public data sources to help us analyze these executives’ entire tenure as CEOs, including personal demographic data (such as age at ascension and departure) and financial performance of their companies. Thus, our study reviews the entire careers of CEOs at the point of their departure. This year, we added a new demographic measure that explored whether departing CEOs were insiders or outsiders at the time of their appointment and compared the performance of the two groups. (See “Methodology,” end of article.)
The events of 2002 underscore a conclusion we advanced in last year’s study: “Shareholder activism and changes in corporate governance have transformed the CEO’s world.” From the employee-shareholder displeasure over a failed merger that prompted the early retirement of AOL Time Warner Inc. CEO Gerald Levin, to the ouster of Deutsche Telekom AG chief Ron Sommer by a German government–shareholder unhappy with the company’s debt and share price, owners of businesses are increasingly exercising the prerogatives of proprietorship.
In 2002, among the world’s 2,500 largest companies, there were 253 succession events — our term for the (usually simultaneous) departure of one chief executive and appointment of another. This CEO “turnover rate” of 10.1 percent, although down from the peak of 11.2 percent in 2000, is up from 9.2 percent in 2001, and dramatically higher than the turnover rate of 6 percent in our benchmark year of 1995.
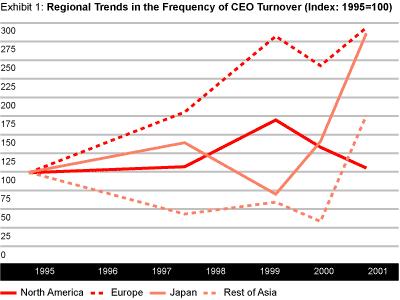
Although the overall rate of turnover has remained fairly stable during the three-year economic down cycle, regional changes have been striking. North America accounted for 48 percent of all successions worldwide in 2002, significantly less than the 64 percent it accounted for in 2001. In Europe, CEO changes in 2002 increased slightly, to 28 percent of the global total, continuing the steady increase in each of the five years examined since 1995. The biggest change occurred in the Asia/Pacific region, which accounted for nearly one of every five global succession events, compared with 8 percent in 2001 and a mere 6 percent in 2000. Taking a closer look, we find that in Japan, the rate of turnover doubled from 2001 to 2002; in the rest of Asia and Australia, the turnover rate quadrupled.
The variations in turnover rate growth among the regions can be seen more clearly when indexed to the rate of succession in the first year we studied, 1995. (See Exhibit 1.)
We classify transitions in three categories: merger-driven, in which a CEO’s job is eliminated after an acquisition; regular, which includes planned retirements, a CEO’s acceptance of a better position elsewhere, health-related departures, or death in office; and performance-related, or forced, which includes any departure initiated by the board, attributed by the media to poor financial or managerial performance, or ascribed to “personal reasons” that cannot be explained except by demonstrable performance shortfalls.
Globally, performance-related successions in 2002 rose by 70 percent over 2001. (See Exhibit 2.) Forced events made up 39 percent of the global total last year; in 2001, they accounted for one-quarter of all successions.

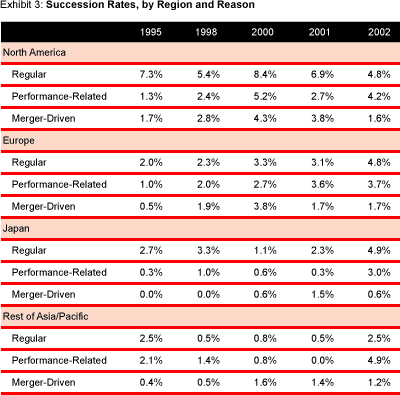
The increase in performance-related turnover is centered in the Asia/Pacific region. The forced turnover rate in Japan — the percentage of the top companies located there that fired their CEO — rose by a factor of 10 from 2001 to 2002. (See Exhibit 3.) In the region outside Japan, the forced turnover rate has more than doubled since 1995. This change is likely due to the region’s gradual transition to Western-style governance procedures. Certainly, the trend has been aided by regulatory change; in Japan, the Commercial Code was revised last year to encourage companies to have outsider representation on their boards. But it’s also undeniable that Asian companies are becoming more sensitized to shareholder concerns — and to the potential for change. The renaissance at Nissan under the leadership of Carlos Ghosn, for example, has persuaded many Japanese companies that beneficial, rapid, strategy-based transformation is not an impossible dream.
The other big shift in 2002 was the decline in merger-related successions. Mergers drove 15 percent of succession events in 2002, compared with 27 percent in 2001 and 29 percent in 2000. Certainly, poor stock market performance contributed to a decrease in merger and acquisition activity generally; potential acquirers lacked share capital, and possible purchases looked less attractive than they might otherwise have. But the ongoing decline in M&A activity may also reflect a decade or more of consolidation among large companies, resulting in a dearth of appealing targets in certain industries. Either way, company leaders are under pressure to find new ways to cut costs, grow revenues at existing businesses, and find new growth engines.
The decline in mergers and acquisitions helps explain one of the bigger surprises in 2002: the fall in the total turnover rate for North American CEOs. Despite a 3 percentage point drop below the 2001 level, North American turnover, when broken down into its component parts, looks consistent with the past — and with the rest of the world. Exhibit 3 shows that the rate of forced departures did increase — by 1.5 percentage points — over 2001, while both merger-related successions and voluntary turnover hit all-time lows.
It might be difficult to discern a ray of sunlight among the dark clouds that are hovering over company leaders around the world, but there may be some solace in our findings, at least for Europeans who have been buffeted by the unsettling wave of “Anglo-Saxon capitalism.” In the U.S., where high performance-driven turnover has been the norm at least since 1998, the total turnover rate has stabilized, the highly publicized departures of some CEOs notwithstanding. Although the European turnover rate has risen rapidly, now that it matches North America’s, the pace may slow. On the other hand, criticism of the cozy relationships between management and supervisory boards in Germany, now reaching a crescendo, may translate into stricter codes of conduct there, and it’s quite possible that the exacting corporate governance regulations proposed by the European Commission will be implemented across EU member states. If these come to pass, a U.S.-style governance crackdown — and an increase in European turnover rates — may be in store.
The U.S. offers a similar puzzle. The fall in total turnover may herald a return to equilibrium. A decline in merger activity could prompt an increase in performance-related turnover, and vice versa; after all, selling the company and firing the CEO are both possible solutions to the same problem. If this is true, we might expect CEO turnover to remain stable in the U.S. next year. Then again, better corporate governance may well continue to drive more forced turnover, and, when the stock market resumes its upward course, merger-driven turnover will probably increase by 1 to 4 percentage points. If this theory is correct, the U.S. CEO turnover rate in 2003 should be at least 13 percent.
When Performance Matters
Poor performance for shareholders continues to be the driver of forced turnover.
Following the standard established last year, we measured the financial performance of the world’s 2,500 largest public companies by total shareholder returns (TSR). The TSR calculation includes both share price appreciation and dividends; since stock market returns can fluctuate considerably and cause anomalies in the assessment of an individual CEO’s performance at the point of his or her departure, we normalized CEO performance by subtracting the average shareholder returns in the region during the CEO’s tenure from the returns at the CEO’s company. Thus, a TSR of 1 percent during a CEO’s tenure indicates that the average annual returns in that company were 1 percentage point higher than the returns on an index fund of all publicly traded stocks in the region during the same period.
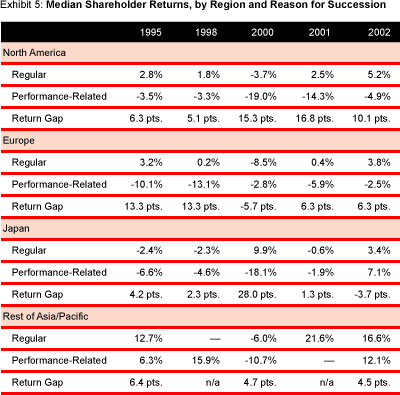
The most arresting finding is that the “return gap” — the difference in TSR between voluntarily retired and fired CEOs — narrowed globally in 2002, declining to 6.2 percentage points from 13.5 points in 2000 and 11.9 points in 2001, returning to the levels observed in 1995 and 1998. (See Exhibit 4.) With forced dismissals continuing to rise, this suggests that performance is being judged more harshly; CEOs are being shown the door for performance shortfalls that would previously have been tolerated, at least in the recent past.

Shareholder returns has long been the measure by which CEO performance has been judged in the U.S.; increasingly, we are seeing that poor TSR is the primary factor underlying attenuated CEO tenure in Europe. Excepting the anomalous year of 2000, the returns generated by European CEOs who were later dismissed have been improving — yet they still are being found wanting. (See Exhibit 5.) In the Asia/Pacific region, the trend is irregular, and made difficult to interpret in part because of the small size of the data set outside Japan. Through the years we studied, we have found a stronger correlation in Japan between net income growth and forced CEO turnover; dismissed CEOs, on average, generated no growth in income during their tenures, whereas regular retirees grew income by 5.2 percent per year. With the Nikkei index hitting an 18-year low — and with some CEOs delivering respectable returns to shareholders despite the poor state of the Japanese economy — we believe that TSR will increasingly become the measure by which leaders are judged successful in Japan.
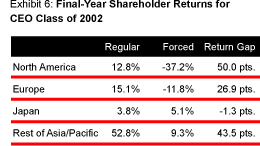 The return gap continues to be greatest during CEOs’ final year in office. (See Exhibit 6.) In Europe, dismissed CEOs’ final-year TSR was a regionally adjusted -11.8 percent in 2002, 27 percentage points lower than the TSRs of CEOs with regular successions. In North America, the performance gap was even larger: CEOs who were pushed out had generated a median regionally adjusted return 50 points below the final-year median returns of those CEOs who left voluntarily. Similarly, in Asia/Pacific outside Japan, CEOs forced to depart in 2002 had created median returns to investors 44 percentage points lower in their final year than those of their regularly departing peers.
 Industry Differences
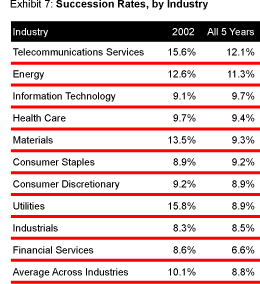
In comparing CEO tenure in different industries, we find more than meets the eye — and less. Total CEO turnover rates in 2002 ranged from a high of almost 16 percent in utilities and telecommunications services to a low of less than 9 percent in consumer staples, industrials, and financial services. (See Exhibit 7). Yet, when we combine the data across the five years analyzed, we find that in most industries, CEO turnover falls into the narrow range of 8.5 to 9.7 percent per year — in line with the five-year global average of 8.8 percent for the top 2,500 companies across industries.
Against this backdrop, two industries with high turnover in the five years studied stand out: telecommunications services (12.1 percent) and energy (11.3 percent). More remarkable is the low turnover in financial services: only 6.6 percent per year. Indeed, financial services had the lowest CEO turnover in four of the previous years we studied and the second lowest turnover in 2002. Although profits buoyed by the bull market might provide an explanation for low turnover in 1998 and 2000, turnover among financial-services CEOs remained low in 2001 and 2002, despite declining performance.
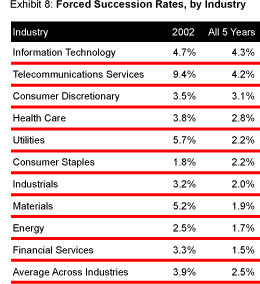 When total succession is divided into its component parts, one conclusion becomes clear: High-tech equals high-risk. Across the five years we analyzed, information technology and telecommunications services experienced the highest levels of forced turnover. During 2002, CEO dismissals in the telecommunications industry were an astonishing 9.4 percent, triple the rate of 2001. Recession-proof consumer staples saw the lowest involuntary turnover rate, only 1.8 percent. (See Exhibit 8.)
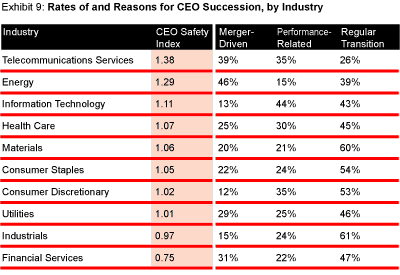
In some industries, there is a strikingly small correlation between total turnover and forced turnover. For example, despite low forced turnover, energy has one of the highest rates of total turnover because of the industry’s level of merger activity. In contrast, in the consumer discretionary sector, where few large firms disappear because of mergers, forced turnover is high, while total turnover is low. Exhibit 9 shows these industry variations, and includes a “CEO Safety Index” — the proportion of CEO turnover in an industry divided by the proportion of succession events at the top 2,500 companies in each year globally — that identifies the relative security of chief executives in different sectors.
Outsiders and Insiders
Selection of a CEO from outside the company always triggers spirited disagreement. Some laud the outside “change agent” who can shake up an organization — as Louis Gerstner did at IBM or Rolf Eckrodt has done at Mitsubishi Motors. Others criticize the outsized pay packages granted and huge promises attached to gunslingers brought in from out of town, such as Gary Wendt at Conseco Inc.
We decided to test the relative performance — and explore the survival rates — of insiders and outsiders. We define “outsider” very narrowly, as someone hired from outside the company into the position of CEO. Executives hired from elsewhere and groomed for a time before becoming CEO are defined as “insiders,” as is anyone who served previously in a senior executive position in the company or on the board.
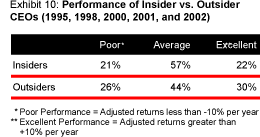 It turns out that both proponents and critics of outsider hires are right: Outsider CEOs disproportionately produce both excellent results — and poor results. Exhibit 10 compares the shareholder returns generated by insider and outsider CEOs, relative to average performance in their regions. Insiders tend to produce average results, while the results of outsiders are more extreme.
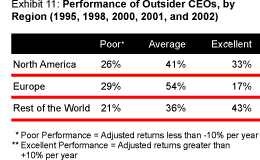 Part of the reason for the variance is a systematic difference in outsiders’ performance across regions. In Europe, outsiders do especially badly, and comparatively few perform excellently. Everywhere else, outsiders have a much better chance of generating excellent results. (See Exhibit 11.)
But the central difference between outsiders and insiders is one of timing. Outsiders perform much better than insiders in the first half of their tenures and much worse in the second half. (See Exhibit 12.)

It’s important to note that the “second-half slump” is a significant challenge confronting all chief executives. When we pool all of our data from North America and Europe, we see that the average CEO generated returns nearly 6 percentage points higher per year in the first half of his or her tenure than in the second half. Our hypothesis is that the cause of the decline is that most new CEOs launch an effective change program that restructures the company, targets new growth opportunities, improves financial results, and creates a year or two of above-average returns. But sustaining that higher level of performance will yield average returns at best, and, in the face of competitors’ responses, usually will result in below-average returns.
For outsiders, the second-half slump is much more acute. There are at least four possible explanations:
- Outsiders are given more latitude by boards to take rapid writedowns, allowing companies to show an early appearance of financial success.
- Through a burst of acquisition activity, outsiders generate rapid results that cannot be sustained.
- Outsiders lose momentum because they do not plan to stay in their positions as long as insiders do.
- Most outsiders actually do shake up the organization, initially creating beneficial change, but face a greater burden than insiders in sustaining the results because of the absence of internal support networks.
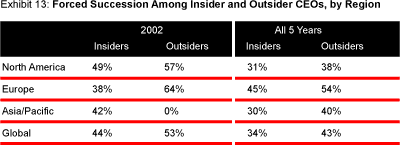
Whatever the explanation, the second-half slump takes a more profound toll on outsiders than insiders. Outsiders face a much greater — and an increasing — probability of being fired. (See Exhibit 13.)
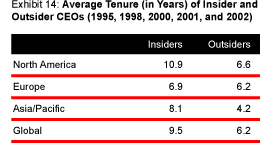 The risk outsiders face is also evident in the length of their tenure. Globally, their service as CEO lasts some three years less than that of insiders. When broken out, Europe seems to be different: Insiders and outsiders average about the same tenure. (See Exhibit 14.)
The portrait of CEO tenure drawn from this data appears to be that outsiders come on extremely strong, are unable to uphold their early promise, and are more likely to generate disaffection among shareholders and dismissals by boards. In other words, the choice of an outsider is a high-risk gamble. Although, on average, the likeliest scenario is that shareholders will be no better off with an insider than with an outsider, outside appointees definitely do generate better returns in the earlier portion of their tenure. But there is also a greater-than-average chance the outsider will be asked to resign early — putting the company through additional, and probably unnecessary, rounds of turmoil.
This picture clarifies a challenge to boards. In appointing an outsider, directors must take pains to help the CEO sustain his or her performance, primarily by helping the leader build support and knowledge networks and create enhanced capabilities throughout the organization. For outsider CEOs — indeed, for all chief executives — it’s imperative to maintain public trust among internal and external constituencies by striking a clear balance between promise and delivery.
In the current environment, that means CEOs must emphasize executional discipline over, or at least in tandem with, visionary boldness. But when growth and its inescapable companion, euphoria, return, leaders will have to strive to set and manage rational expectations among their audiences, or face the ire that clearly attends unmet potential. Although performance matters, our data shows that matching (and ideally exceeding) market norms in a region over the longer term secures a better future than engaging in numbers games with financial analysts and the business media. That argues in favor of company leaders’ holding themselves to a standard, such as top-quartile TSR for an industry, rather than specific earnings targets. It also requires leaders to consistently explain these benchmarks and their performance against them in order to establish a context for their stewardship and an ongoing rationale for the company’s strategy.
Grecian Formula
There was another twist on the insider versus outsider phenomenon in 2002, at least anecdotally: “the return of the Jedi.”
With boards showing a preference for gray hair and long experience over the New Economy emphasis on youthful vision, veteran CEOs came back, on an interim or full-appointment basis, to Bertelsmann and Deutsche Telekom in Germany. The apparent trend continued into 2003 with, for example, former CBS CEO Michael H. Jordan taking the helm at the Electronic Data Systems Corporation when the technology consulting firm’s board dismissed chief executive Richard Brown (himself a former CEO) after four years on the job.
Appearances can be deceiving, however: Our research indicates that hiring former CEOs is yesterday’s fashion; the trend has become less pronounced over time. Using the year’s “graduating class” as a proxy, we found that in 1998 virtually all outsider CEOs had been a top dog before. In 2002, only half of outsiders had previously served in a chief executive role. When we compared the performance of multiple-service CEOs with first-time leaders, we found out why: Serial CEOs underperform first-timers — both other outsiders and insiders.
Previous experience notwithstanding, our data does show that CEOs grew a bit grayer last year. The mean age of chief executives leaving office in 2002 was 58.1, up slightly from 2000 (56.8) and 2001 (57.1), although still lower than 1995, when departing CEOs were, on average, nearly 62 years old. (See Exhibit 15.) Outgoing European CEOs are an average of two years younger than their American counterparts. And Asian CEOs, although the elder statesmen of the group at 61.1 years on departure, have grown younger, due almost entirely to the increase in forced successions in 2002.

There has been little change in the age at which chief executives start their CEO careers. The departing class of 2002 had a mean start-of-tenure age of 49.4, close to the global average for the five years (49.9). As we observed last year, Asian CEOs are older upon ascension than their European and North American counterparts. But there was a dramatic decline in the age of appointment for the 2002 graduating class in Asia/Pacific; its mean age, 52.4, was down eight years from 2001, and was the lowest of all the years we studied.
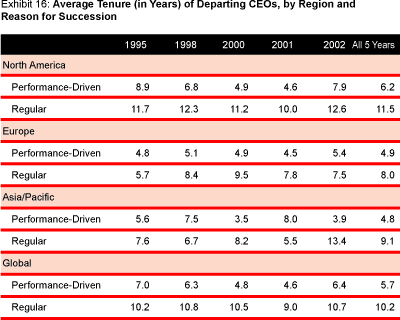
The mean length of tenure for the departing CEO class of 2002, 8.6 years, was higher than we’ve seen in several years. Regionally, North American CEOs enjoyed the longest tenures (10.3 years), followed by Asia/Pacific (8.7) and Europe (6.6). Even CEOs who were forced from office in 2002 experienced longer tenures than those who were forced out in 2000 and 2001. The average tenure for North American CEOs forced from office in 2002 was 7.9 years, the longest since 1995; in Europe, the mean tenure length for such CEOs was 5.4 years, the longest of all the years we have studied. Asia/Pacific was the outlier again: CEOs removed from their jobs had the shortest tenures of any — 3.9 years. (See Exhibit 16.)
The Improvement Imperative
The slight increase in CEO tenure and age should not mask the trend we have seen advancing since the mid-1990s. The professional life of a large company’s chief executive increasingly resembles that of the Hobbesian man: It is nasty, brutish, and short.
The volatility in the chief executive’s career is a natural outcome of a two-decade trend toward the “celebritizing” of individual CEOs, certainly in the U.S. and Europe. Because it is easier to attribute causality to individuals than to institutional, cultural, or economic forces, the business media in the United States, followed by securities analysts and shareholders, created cults of personality around chief executives. During the bull market of the 1980s and 1990s, it became easier for the finance industry, boards, and even CEOs themselves around the world to adopt this heroic view of leadership. Jean-Marie Messier, whose $50 billion, acquisition-fueled campaign transformed the French water company Compagnie Générale des Eaux into the media company Vivendi Universal, even authored a book titled J6M.com; the title stood for “Jean-Marie Messier, Moi-Même, Maître du Monde,” or “Me, Myself, Master of the Universe.” Once the market turned, it was easy for heroes to fall from grace. Mr. Messier, for example, was dismissed by Vivendi’s board in the summer of 2002, after seven years at the helm.
Although such careers make for great drama, they are not necessarily good for the rest of us — the shareholders, employees, suppliers, customers, and neighbors of large companies, who desire fulfilling lives, safe communities, and secure retirements.
We believe the time has come for moderation, a renewed sense of purpose, and a new model for the way chief executives and boards collaborate on their stakeholders’ behalf. All CEOs are human; even the best have weaknesses. Removing a poorly performing chief executive is far less valuable to stakeholders than finding the right CEO, helping the chief recognize his or her limitations, then contributing to the individual’s (and the company’s) success.
In that light, we offer five observations to CEOs, boards, and the others on whom the future of shareholder capitalism rests:
Individual leadership still matters. In their rush to demonize CEOs, some critics have concluded that the only forces that determine corporate performance are institutional and macroeconomic. Clearly, we need to put some aspects of the “cult of the CEO” behind us, but in dispersed organizations, extended enterprises, and service-oriented companies, the background, skills, leadership style, and personality of a CEO are central to the firm’s ability to achieve alignment. Global companies, especially, simply will not be able to go back to the days of anonymous, collective decision making.
Execution and vision cannot be divided. Conservative management models are in vogue — and long may they reign: Few skill sets are as important to a CEO as what Larry Bossidy and Ram Charan term “the discipline of getting things done.” But it’s equally important to know what to do. Creative, strategic thinking is as valuable today as ever. So is communicating it effectively, inside the company and out.
Hit the ground running — and then keep running. The grace period for a new CEO is becoming shorter and shorter. New CEOs have to set their agenda fast and implement it in five to seven years. When that strategic agenda draws to a close, it’s time to set the next one. The second-half slump must be avoided.
The board shouldn’t just be judge and jury; it must be coach and counselor. Boards, particularly in the U.S., are being asked to shoulder greater oversight of corporate performance. Rather than get mired in fault finding, directors should strive to help chief executives overcome the hurdles most will eventually face: sustaining above-average returns in the second half of the CEO’s tenure; helping the CEO, particularly if he or she is an outsider, understand the company’s heritage and culture; and guiding the new CEO toward changes that last. For all these reasons, companies should seriously consider separating the roles of chairman and CEO, or at least appointing a lead director. A good chairman and a good board are the CEO’s best allies.
Let’s help the board become more effective, too. The governance debate should be broadened to include discussions of the effectiveness of the board in performing all of its roles. A balanced scorecard of board metrics should be created to assess not only the board’s independence and the transparency of financial accounting, but also the board’s effectiveness as a counselor and the results achieved for shareholders in both the short and the long term. ![]()
Reprint No. 03204
Also contributing to this article was Julien Beresford (beresford_julien@bah.com), president of The Beresford Group, a research company based in Westport, Conn.
|
Methodology |
|
This study required the identification of the world’s 2,500 largest public companies, defined by their market capitalization on January 1, 2002. We used market capitalization rather than revenues because of the different ways financial companies recognize and account for revenues. The Compustat/Global Vantage database of public companies provided a ranking of all publicly traded companies on December 31, 2002. To identify the companies among the top 2,500 that had experienced a chief executive succession event, we used a file of executive changes provided by idEXEC (a global business-to-business contact database of executive decision makers). We also used a variety of printed and electronic sources, including Corporate Yellow Book and Financial Yellow Book (both published by Leadership Directories, N.Y.); Fortune; the Financial Times; the Wall Street Journal, and several Web sites containing information on CEO changes (www.executiveselect.com, www.ceogo.com, and www.chiefexecutive.net). Additionally, we conducted electronic searches using Factiva for any announcements of retirements or new appointments of chief executives, presidents, managing directors, and chairmen; results of this search were compared to the list of top 2,500 companies. For firms that had been acquired or merged in any of the subject years, we used the Thomson Financial Mergers & Acquisitions database. Finally, we consulted the marketing personnel of Booz Allen Hamilton offices outside the U.S. to add any CEO changes in their regions that had not been identified. Each company that appeared to have experienced a CEO change was then investigated to confirm that a change had occurred in 2002 and for identification of the outgoing executive: title(s) upon succession, starting and ending dates of tenure as chief executive, age, education, whether an insider or outsider immediately prior to the start of tenure, whether he or she had served as a CEO elsewhere prior to this tenure, and the true reason for the succession event. Company-provided information was acceptable for each of these data elements except for the reason for the succession; an outside press report was necessary to learn the true reason for an executive’s departure (because company press releases often obscure it). We used a variety of online sources to collect this information on each CEO tenure, including company Web sites, the Factiva database, and proxy statements available on the U.S. Securities and Exchange Commission’s (SEC’s) EDGAR database (for U.S.-traded securities). In some cases, when the online sources were unproductive, we contacted the individual companies by e-mail and telephone to confirm the tenure information. We also enlisted the assistance of Booz Allen Hamilton offices worldwide as part of this effort to learn the reasons for specific CEO changes in their regions. We then calculated average growth rates (AGRs for total tenure, first half, and second half) for two types of financial and shareholder information for each executive’s tenure: net income and total shareholder return (TSR, including the reinvestment of dividends, if any). Net income data was provided by S&P (Custom Projects); quarterly data was provided for North American–traded securities, and annual data was provided for other firms. To enable meaningful cross-industry comparisons, we also collected the income data information for the relevant industry and region (e.g., automobiles in North America, Europe, Asia/Pacific, South America, or Africa) and subtracted the regional industry income growth from the company’s average growth in the same period. TSR data was provided by Thomson Financial Datastream. Regionally adjusted TSR AGRs were calculated by subtracting the Morgan Stanley regional shareholder return indices from the company’s performance during the periods in question. |
| Authors
Chuck Lucier, chuck@chucklucier.com Chuck Lucier is senior vice president emeritus of Booz Allen Hamilton. He is currently writing a book and consulting on strategy and knowledge issues with selected clients. For Mr. Lucier’s latest publications, see www.chucklucier.com. Rob Schuyt, schuyt_rob@bah.com Rob Schuyt is a vice president with Booz Allen Hamilton in Amsterdam. His expertise is in developing growth, innovation strategies, and performance improvement for clients in the media and communications industries. Eric Spiegel, spiegel_eric@bah.com Eric Spiegel is a senior vice president with Booz Allen Hamilton in Tokyo and the managing director of the firm’s international businesses outside the U.S. and Europe. His work focuses on strategy, organization, and operations improvement, primarily for large energy and industrial companies. |

