
Creating Value Through E.V.A.- Myth or Reality?
"Economic value added" has received a great deal of attention as a management tool. It is effective, but are all E.V. A.'s alike? And how do companies employ the technique to achieve their goals?
Because it measures value creation, the method known as "economic value added," or E.V.A., has made its way in recent years into speeches given by chief executives and has invaded the "To Our Shareholders" section of annual reports. Many companies have adopted E.V.A. as their key performance metric, even linking it to the fortunes of their executives.
The method's growing popularity reflects the realization that the performance metrics used in the past, notably return on equity and others based solely on accounting figures, are largely wanting when it comes to measuring the creation of value.
This article addresses the benefits of E.V.A. that are heralded by its developers and its ardent supporters. But it also looks at some aspects of the approach that can pose problems and reduce its utility.
While the attractiveness of E.V.A. comes, in large part, from the seeming simplicity of its application, the technique brings substantial challenges if it is to be used well. Unless the right factors and adjustments are taken into account when applying E.V.A., to reflect the unique identity of each company, it becomes difficult to get an accurate picture of value.
But which factors and which adjustments, and how many? If too few are taken into account, the picture will be hazy or distorted. Too many, and the process risks becoming too complicated to be used. Still, the choices must be sorted out if a company wants to get a true sense of its situation and make meaningful comparisons in judging the performance of its various divisions and business units.
The question of comparability becomes even more tangled, however, in trying to assess one company's E.V.A. against another's. Because of E.V.A.'s relative newness, there is an absence of generally accepted rules to guide its application and to determine what it is actually measuring. That means companies can pick and choose among the multitude of possible adjustments, creating something of a free-for-all in the metrics marketplace, a situation that awaits a regulatory referee to sort out.
Finally, because companies -- and their business units -- have their own special characteristics, E.V.A. might not always be the ideal value proxy to use. Companies that are particularly sensitive to the availability of capital, for example, might do better to use a proxy known as cash value added, or C.V.A., either alone or in conjunction with E.V.A.
The practical effect of all this is to help managers understand that while E.V.A. can bring a bounty of benefits, it does not come without a price. To make that price more palatable, the article identifies a number of E.V.A. trouble spots and shortcomings, along with ways to deal with them.
A History of Value-Proxy Performance Measures
Business has always admired bigness, and during the late age of conglomeration, size was considered a proxy for value. Acquisitions-oriented executives would trumpet their expanding corporate assets, and boards could be expected to link pay to the amount of assets under management. Unfortunately, size per se does not have anything to do with value. As a result, asset size as a value proxy quickly lost its popularity. Companies began spinning off their disparate units only to find they were adding value in the process.
Enter net earnings as the value proxy of choice. Net earnings is a residual -- what's left over after everybody has received their paychecks, and after other expenses, the creditors and the tax collectors have been satisfied. What has made net earnings the most utilized proxy for value creation is the consistency required by accounting principles in calculating this measure. With net earnings determined, other performance measures naturally follow; return on assets (R.O.A.), return on investment (R.O.I.) and return on equity (R.O.E.) are the most common. Net earnings can also be put on a per share basis, further tightening the perceived connection between performance and shareholder value.
Net earnings, together with its derived performance measures, remains popular despite two major shortcomings. For one thing, it is an accounting metric that mixes historical concepts like depreciation, past costs, accruals and others with the current market. For another, it does not reflect different levels of risk among companies. Utilizing R.O.A. and R.O.E. to determine whether value creation has occurred ignores the timing of both costs and benefits and thus ignores the full range of their impact on the shareholder.
Enter E.V.A., a performance measurement concept introduced to the corporate arena in the 1920's, by the General Motors Corporation, and then forgotten, until Stern Stewart & Company, a New York-based consulting firm, reintroduced it in the 80's as a replacement for the traditional measure of value creation. The approach is now trademarked by Stern Stewart.
One of E.V.A.'s most important contributions was bringing to light the fact that equity has a cost, albeit not as readily apparent as the cost of debt (interest expense). To compete successfully for scarce resources in the capital markets, a corporation must earn for its shareholders an amount equal to the risk-adjusted return that its capital providers could earn on a myriad of other investments. Thus, the central message of E.V.A. is that it is not good enough to have a positive net income or a certain level of earnings per share. Rather, the corporation must earn enough to cover the cost of debt and the opportunity cost of equity before it even begins to create value.
Economic value added helps managers understand the real drivers of business performance, which often go unnoticed. Once E.V.A. is embraced, decisions relative to the drivers of performance can be made more consciously.
For companies to realize the potential of E.V.A., they must do the following:
![]() determine those situations in which its use is likely to generate incremental value for the firm.
determine those situations in which its use is likely to generate incremental value for the firm.
![]() understand how to effectively implement E.V.A.
understand how to effectively implement E.V.A.
![]() appropriately modify economic value added, when required.
appropriately modify economic value added, when required.
![]() understand that E.V.A., although important, is not as important as changes in E.V.A. and the prospects for future improvements.
understand that E.V.A., although important, is not as important as changes in E.V.A. and the prospects for future improvements.
![]() communicate both inside and outside the corporation that an improvement in economic value added, not earnings or earnings per share, is how value creation is measured.
communicate both inside and outside the corporation that an improvement in economic value added, not earnings or earnings per share, is how value creation is measured.
As analysts learn that E.V.A. is being used as the company's benchmark for value creation, they become more comfortable with the likely prospects for the firm's shareholders. And as discussions with numerous executives and analysts across the country show, companies are using E.V.A. as a guidepost in making numerous kinds of decisions.
Is E.V.A. Really That Simple?
Executives with whom we have spoken point to the ease with which managers grasp and apply the concept of E.V.A. A little training and an adequate supply of data from finance, they say, make it possible for even non-financial employees to recognize the factors under their control that add or subtract from economic profits. By inference, this is one of the advantages of economic value added over the discounted cash flow methods. Those methods determine the present value of each of the company's cash flows and often are somewhat cumbersome to apply.
But while the beauty of economic value added is its conceptual simplicity, its developers, including Bennett Stewart, point to 164 potential accounting adjustments that must be made to obtain a "real" reflection of company performance. In other words, although the concept is frequently applied in a very basic, easy-to-understand format, numerous complex adjustments must often be made to correctly assess a company's situation. Mr. Stewart's list of adjustments includes the following:
"... inventory costing and valuation; seasonality; depreciation; revenue recognition; the writing off of bad debts; the capitalization and amortization of R&D; market-building outlays, restructuring charges, acquisition premiums and other 'strategic' investments with deferred payoff patterns; mandated investments in safety and environmental compliance; pension and post-retirement medical expense; valuation of contingent liabilities and hedges; transfer payments and overhead allocations; captive finance and insurance companies; joint ventures and startups; and special issues of taxation, inflation and currency translation."1
Depending on the circumstances of a particular company, failure to account for any of these may distort measured E.V.A. performance by millions of dollars. Even determining the level of capital used in an operating unit can be daunting.
Georgia-Pacific felt that the use of book values for assessing capital charges would create a significant bias between different operating units. For instance, G.P.'s building products unit had highly depreciated assets, making its book values far lower than their market values. At the same time, book and market values for capital assets in the pulp and paper unit were fairly close. The use of book values company-wide would have overestimated the E.V.A. performance of the building products unit relative to the pulp and paper unit. To overcome this potential bias, G.P. used market values -- again, not an easy thing to calculate -- to determine the level of capital deployed in each division.
At the Whirlpool Corporation, the merits of 140 adjustments were debated prior to implementation, and a decision was reached to make adjustments only for factors that made a big difference. In the end, adjustments were made in only four areas: goodwill, capitalized leases, restructuring charges -- which are viewed as an investment -- and minority interests in investments.
This limited number of adjustments is typical. Yet, interestingly, there is no standard way of making adjustments. Each company does it independently, with no FASB or regulatory supervision to determine what is appropriate to adjust and what is not. In particular, companies select adjustments that are of the greatest relevance to their businesses.
Coca-Cola has made as many as 15 adjustments at the company level. Starting in 1995, however, when all levels of the company began implementing the system, the calculation was greatly simplified; only a few adjustments were made to remove items over which managers had no control.
"We are concerned that if we introduce too many complexities into the calculation, the general understanding of what is happening will deteriorate," said Michael Stewart, financial project manager. "We recognize that in a perfect world, we should adjust the cost of capital. Perhaps we'll refine it, but to really drive it down into the organization, we need to keep it simple."
If practitioners insist on making complex adjustments, they may encounter the same problems faced by the Scott Paper Company and Deere & Company. In turning around Scott Paper, Albert J. Dunlap, the chief executive, found that there were benefits to using the E.V.A. system, but the adjustments and complexities were so great that he didn't see a need for implementing the concept. By contrast, Deere's finance division attempted to implement an E.V.A. mentality among its executives. At first, the effort failed because operating managers could not understand all of the adjustments. Then the finance division reasoned that only a few adjustments were critical to calculate an E.V.A. that reflected most of the potential value creation. Today, at Deere, as a result of simplifying the calculation, E.V.A. has become an accepted method of determining value creation.
To the extent that only a few easy-to-understand adjustments are necessary, E.V.A. can be particularly beneficial. As the adjustments become more complex, however, its utility becomes compromised.
1 G. Bennett Stewart 3d, "E.V.A.: Fact and Fantasy," Journal of Applied Corporate Finance (Summer 1994).
Comparability Between Companies
Direct comparability of company reports of E.V.A. will be a problem as long as the companies are inconsistent in how they make adjustments. For that reason, the same adjustments must be made to each company's financial figures if those adjustments have a significant impact on E.V.A. Traditional tools of comparison, such as return on assets and return on equity, have the benefit of being based upon common rules of measurement -- generally accepted accounting principles (GAAP). There is no denying that GAAP requires abundant explanation in the form of footnotes and gives companies plenty of "wiggle room" in measuring the factors that determine R.O.A. and R.O.E. Those metrics, nevertheless, are seen as an authentic basis for comparison. Until similar guidelines are established to "standardize" E.V.A., it is far more suited for internal measurements than for cross-company analyses.
The Compatibility of E.V.A. and Discounted Cash Flow
Most financial professionals regard discounted cash flow techniques, or D.C.F., as the most powerful tool at their disposal. Indeed, for evaluating future investments and allocating capital to its highest return uses, the D.C.F. concept has proven its worth. That is because D.C.F. incorporates the factors that matter in assessing economic value: cash flows (instead of accounting measures) and cost of capital (at the discount rate). Projects that produce a positive net present value, by definition, create economic value in excess of the cost of capital.
Most operating managers, regrettably, find the accounting adjustments required to determine their business unit cash flows puzzling, and the mathematics of D.C.F. intimidates others. Thus the growing popularity of E.V.A. as a forward- looking measurement tool.
Fortunately, D.C.F. and E.V.A. are compatible -- i.e., they produce identical results -- when all adjustments and identical assumptions are made. Executives who have come to rely on D.C.F. techniques to evaluate potential investments need not worry that the advocates of E.V.A. will use their new methodology to drive their companies into a financial abyss. In fact, Whirlpool is just one of several companies we have encountered that conduct both D.C.F. and E.V.A. analysis of projects. When the outcomes do not match, Whirlpool's analysts go back and find the discrepancy in assumptions or the source of the error. Performing both analyses provides a company with an internal control system based on compatibility.
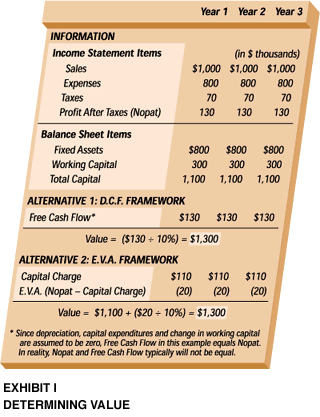
To appreciate this compatibility, consider the situation in Exhibit I, which shows the relevant income statement and balance sheet items for a company with level operations over three years. For simplicity, let us suppose that all income statement items are cash, that net capital investment (depreciation less capital expenditures less increases in working capital) is zero, that the firm is all-equity financed and that this cash-flow stream is expected to continue into the future. If the cost of capital is 10 percent, the D.C.F. calculation leads to a value of $1.3 million. (Here we use the formula for determining the present value of a perpetual cash-flow stream: PV = CF/Discount rate. The cash flow in each period is the same.)
Now, consider the same business using E.V.A. First, we quantify the amount of capital used in the business. As Exhibit I indicates, this business has fixed capital assets of $800,000 and working capital of $300,000 for a total of $1.1 million in capital. If the total capital is not expected to change over time, the annual cost of capital is $110,000 ($1.1 million x 10 percent).
To determine the E.V.A. each year, we simply subtract this annual capital charge from Nopat ($130,000 $110,000 = $20,000). The value of this company is then the value of its total capital ($1.1 million) plus the discounted value of a perpetual stream of each year's E.V.A. (20/0.10 = $0.2 million), or $1.3 million, as in the D.C.F. version. Thus, under this set of simplified assumptions, E.V.A. and D.C.F. are compatible.
The Problem of Fluctuations
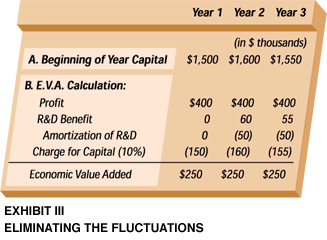
Besides its greater simplicity, E.V.A. has the added benefit of reporting less volatile fluctuations in bottom-line measures. To appreciate this benefit, consider a company that projects $400,000 in profits in each of the next three years. Its product managers are considering a $100,000 R&D investment, expensed in Year 1, which they estimate will produce incremental profits of $60,000 and $55,000 in Years 2 and 3, respectively.

As the bottom line of Exhibit II makes clear, the investment creates sharp fluctuations in adjusted profits. Return on assets, return on equity and profits all suffer in Year 1. These measures improve in Year 2, but then decline slightly in Year 3. The company's compensation system may be such that the product managers will drop the project simply to avoid the Year 1 negative effects.
There is plenty of evidence that compensation plans influence managerial behavior in ways that sacrifice long-term benefits to optimize short-term results.
The elimination of such sharp fluctuations in annual profits is one of the dividends of economic value added. As illustrated in Exhibit III, E.V.A. methodology capitalizes the R&D expense and amortizes its impact over the years in which its benefits are received. Unlike the fluctuating year-to-year adjusted profit, derived from the traditional performance measures, the E.V.A. result is a smoothing of the performance figures. This may encourage managers to take the longer view toward their investments.
The Multi-Division Company
Critics have long decried the single, corporate-wide hurdle rate, which sets a minimum acceptable rate of return for projects. Business units with different risk characteristics obviously should produce different levels of return to capital providers. Also, single hurdle rates cause corporations to accept high-risk projects that should be rejected and to reject low-risk projects that should be accepted. Yet single rates appear to be the rule. The dilemma faced by multi-division companies is in choosing between accuracy and simplicity. Apparently, a single number is easier to "sell." A multi-division company in diverse segments should, however, calculate more than one cost of capital.
Take the case of Deere, which operates in the health care, credit and insurance businesses as well as the agricultural, industrial and lawn/grounds care equipment businesses. The risks inherent in the first three activities are different from the more traditional equipment businesses. As a result, Deere uses four hurdle rates or costs of capital. Utilizing these different rates gives management a more accurate picture of value creation and allows better comparisons among the business units.
Obviously, not every company must use multiple hurdle rates. Honeywell, for example, conducted a study of the different market risks associated with its three core businesses: home and building controls, industrial controls and space and aviation controls. To its surprise, all fell within a narrow range of risk. As a result, Honeywell implemented a single, corporate-wide hurdle rate. Briggs & Stratton and Georgia-Pacific reached the same conclusion about risk across their operating units. Transamerica's several divisions, on the other hand, apply different cost-of-capital charges when measuring economic value added. AT&T does the same.
The Changing Interest Rate Environment
There is plenty of evidence that most companies are reluctant to change their hurdle rate or cost of capital even when the cost of money changes. Over the past 20 years, for example, interest rates have varied between 5 percent and 20 percent. The cost of equity has also fluctuated broadly. Historically, it has been about 5.4 percent higher than the cost of 20-year risk-free debt, as measured by the geometric averages. Changes in capital structures were ongoing during this period as well, with related changes in the weighted average cost of capital. Nevertheless, few companies significantly altered their hurdle rates.
Communication
Internal and external communication are crucial to accelerate the implementation of E.V.A. Following a few simple rules will help.
Recognize that direction is more important than perfection. It is better to change a company's focus and direction than to measure perfectly the creation of shareholder value. Take whatever steps a company will allow, without regard for perfection. As with all thought systems, clarity will follow once the direction is established.
Listen to your audience or they will not listen to you. In measuring value creation do not become wedded to a particular name. There are still a number of corporations where economic value added and cost of capital are frightening terms. There are other corporations where resistance will be encountered because certain managers will resent being measured by the true cost of capital.
Listen to these concerns and attempt to develop E.V.A. proxies. As an example, even though it may be inefficient to use two measures such as R.O.A. and growth as a metric, use them if your audience accepts them rather than E.V.A. One method of calculating a meaningful R.O.A. target is by reverse-engineering the goal. This can be done by determining an E.V.A. improvement that is acceptable, given forecasted average assets, and translating it to an R.O.A. goal that is equivalent. In order to prevent value-destroying strategies, a growth target must also be established.
Utilize the synergistic power of internal and external communication. When companies begin talking about E.V.A. to Wall Street analysts, the analysts begin asking more about E.V.A. This increases internal acceptance and speeds the move toward E.V.A. The more companies explain their goal to analysts as E.V.A. improvement, the less analysts worry about the absolute levels of R.O.A., income, etc. The communication coming from inside the company has an impact on external stakeholders just as external questioning will have an impact on internal stakeholders.
Michael Mauboussin, a food industry analyst for CS First Boston, has used an "E.V.A. report card" for five years, provoking genuine interest among the companies he follows. "An economic value added report card has compelled some of the poorer-performing companies to reassess their strategies," Mr. Mauboussin notes, when they recognize that "the model is based on solid economics and represents a better way to quantify expectations."
The symbiotic relationship between internal and external communication creates a synergy that will speed the adoption of E.V.A.
Increasing Shareholder Value:
Applying the Value Creation Grid
Clearly, no single measure meets the needs of all companies in all situations. Some companies have easy access to cash, while others do not. Some require major capital investments. Still others, such as service companies, may use very little capital. Some companies are growing rapidly, while others are mature and growing slowly. Some experience similar levels of risk across business units, while others have high-risk and low-risk businesses under one corporate roof. Operating income reflects a long list of nonintuitive accounting adjustments at some companies, while income statements are more straightforward at others.
Given these differences, management must analyze its company's characteristics before selecting a proxy for value. For most companies, this measure will be one that is under management control, identifiable at the business unit level and associated with shareholder value. Although shareholders' total return is the most direct measure of shareholder wealth and serves better as a company-wide measure, it is not under business unit control. Therefore, measures that are not stock market-based appear more appropriate for most business units.
In determining which value proxy is most appropriate, the cash sensitivity of the company is highly relevant. Managers learned during the 1980's that cash is the key to consistently creating long-term value. Yet, many companies have also learned that cash availability is uncertain. In normal times, most Fortune 500 companies have access to capital markets and a network of banking relationships, but this can change dramatically when the economy shifts into slower growth or recession. Executives are often surprised by how quickly cash availability can evaporate. The speed at which a cash crisis can develop is related to the company's "cash sensitivity," which is a function of business risk, including the organization's cyclicality, its financial risk and its overall sensitivity to economy-wide fluctuations.
A company or business unit with a material chance for sizable, unforeseen cash needs relative to its available cash resources is cash sensitive. The ability to create cash must be an integral factor in determining the most appropriate value measure for such a business.
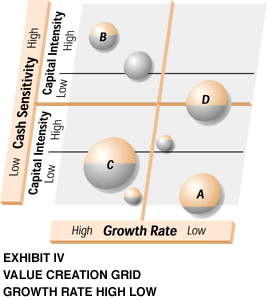
Exhibit IV presents a method for selecting such a measure: the value creation grid. Initially, the grid classifies the business unit by its cash sensitivity. The unit is further classified by its growth rate and capital intensity. The size of the circle indicates the relative size of the unit. Finally, a determination is made as to which accounting adjustments are needed to reflect the unit's performance. The extent of these adjustments is indicated by the proportion of the circle that is shaded.
Consider business unit A -- a mature, low-growth operation with few requirements for capital expenditures. Given its history, unit A is unlikely to face sizable cash needs relative to its available resources. Moreover, the need to adjust the unit's financials to obtain a useful income figure is limited. For this business unit, E.V.A. is the most appropriate choice.
In contrast, unit B is a high-growth, capital-intensive operation with limited access to cash. Unlike unit A, its reported results require a moderate number of E.V.A. adjustments. Obviously, a dominant element in B's characteristics is its dependence on cash and its limited ability to meet significant unplanned cash needs. Given that R.O.A. and E.V.A. are not based on cash, these measures could produce misleading indications of unit performance. To understand the need for a more appropriate measure of value creation for a unit such as B, consider the following situation.
We were recently retained to assess the events leading to the bankruptcy filing of a major transportation company. The company had a well-established reputation extending back to the beginning of the century. It had a sizable market share and a consistent record of revenue growth. Its management was experienced and innovative, emphasizing value, operational improvement and service excellence. During the growth years of the 1980's, both management and shareholders were rewarded.
But the recession of 1990 took the steam out of the company's growth, and within several months its cash resources were depleted. Although cash was draining steadily, management was unaware of the seriousness of its cash crisis until two months prior to its bankruptcy filing. Neither R.O.A. nor E.V.A. would have alerted managers to the cash deterioration. Lack of sensitivity to its cash position turned a healthy, value-creating organization into a company that could not meet its current obligations.
To create long-term value, it is crucial to evaluate cash needs relative to cash availability. Thus, another value proxy -- a measure we call cash value added, or C.V.A. -- is more appropriate for cash-sensitive companies. C.V.A. is a business unit's operating cash less the charges for the capital employed by the unit. C.V.A. is more reflective of a unit's cash position than are value proxies that focus on operating income, an accounting measure. Moreover, E.V.A. takes the operating income, which is not cash to begin with, and further smoothes it to adjust for unusual items. These unusual items, however, may well pose a financial strain in a high-growth, capital-intensive business with high cash sensitivity, like unit B. The long-term interests of shareholders are well served if cash is emphasized. Therefore, to provide managerial incentives, compensation should be related to C.V.A.
Another example is business unit C, located in the southwest corner of the grid. Unit C is large, rapidly growing, reliant on physical capital and can quickly access cash should unforeseen needs arise. The unit has characteristics similar to a cellular telephone subsidiary of a large communications company with which we work. Since the parent company of the cellular unit is cash-rich and eager to penetrate its market, the subsidiary receives ample support and capital. Thus, despite its high growth and increasing needs for working capital, the cellular unit can be classified as having relatively low cash sensitivity. E.V.A., therefore, is the most reliable measure of its business performance. The same holds for unit C. However, if the unit's parent put a lower priority on self-funding its subsidiary, or if a large number of adjustments were needed, the subsidiary would be a prime candidate to use C.V.A. as a value measure.
Finally, there is unit D, which is similar in many respects to A. It is a low-growth, low-capital-intensity unit. But it differs from A in that it is cash sensitive. The unit's low growth, small capital requirements and small number of required adjustments would ordinarily make E.V.A. the most appropriate measure. However, due to unit D's limited resources to meet unforeseeable needs, the C.V.A. framework may well be the preferred choice.
So far, growth rate and capital intensity were assumed to be the dominant factors in determining cash needs. This assumption, however, may not always hold. Therefore, analysis is needed prior to application of the value creation grid. In some industries, such as airlines and supermarkets, growth triggers increases in payables at a higher rate than it increases receivables. The result: companies in these industries are likely to segment the value creation grid based on factors other than growth. Thus, the grid should be used as a flexible rather than a rigid framework for analysis.
As noted earlier, most companies, as a practical matter, apply a single performance measure across business units despite the fact that there is rarely a single "best" measure for the entire organization. While a grid analysis might show that E.V.A. is most appropriate for several units, C.V.A. may be the most relevant for others. To determine the combination of measures that best serves the entire organization, management must first analyze every business unit using the grid and then apply criteria such as simplicity, ease of implementation and relevance to value creation.
The Incentive Compensation Pyramid
A critical factor in converting E.V.A. and C.V.A. measurements into corporate success is to make them the basis of an incentive compensation plan that encourages managers to think and act like owners. Under such a plan, managers are rewarded for creating value instead of "making a budget." Conventional incentive schemes tie bonuses to achieving a target negotiated with upper management or the board, a process that tends to corrupt planning and budgeting by perversely encouraging managers to understate and underperform the true potential for their business.
A far better incentive is to pay managers for improvements in E.V.A. and C.V.A., with no caps or limits on what they can earn. A properly constructed bonus plan can effectively turn managers into owners of the individual units under their control, with the result that they become more entrepreneurial and operate with a renewed sense of urgency. Budgets and plans are then based on strategy, rather than the hopes and fears surrounding an annual bonus.
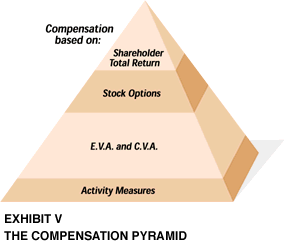
Different levels of management obviously require a different compensation mix, with each manager's bonus based mostly on the specific E.V.A/C.V.A. that he or she can affect. Senior executives -- the chief executive and other key decision-makers -- have a direct responsibility to shareholders. These executives should receive bonuses tied to shareholders' total return, stock options to incentivize future performance and compensation linked to company-wide measures, such as E.V.A. and C.V.A. (See Exhibit V.)
At Honeywell, senior executive compensation is tied not only to the company's performance, but also to its ranking within its peer group. Assessing performance relative to other companies solves the problem of penalizing senior management for macroeconomic events, like a cyclical downturn or recession, which are out of its control.
Second-level executives, typically key division managers, play a major role in creating value, yet have little direct shareholder responsibility. To best reward them for their influence on shareholder value, their incentive compensation is partly based on stock options but to a larger degree on E.V.A.
Middle and upper-middle managers are generally responsible for a given level of capital and have P.&L. responsibility. Since unit operating income or operating cash can be determined, the most direct measure for such managers is unit E.V.A. or C.V.A. To encourage cooperation among division/unit managers, a portion of their compensation should be tied to company-wide C.V.A. or E.V.A. This reduces the conflicts and parochialism that boundaries between business units and functions typically produce.
In establishing C.V.A. and E.V.A. objectives for a company division or unit, the focus should be on C.V.A. and E.V.A. improvements, regardless of their absolute level. It is actually their improvement and the prospects of improvement that have the effect of creating value above the price paid by shareholders.
Finally, certain managers are responsible for only a subset of the factors needed to calculate C.V.A. and E.V.A. For these managers, specific, relevant activity measures should be used. For example, an inventory manager may well be evaluated based on both inventory turnover and adequacy of inventory. The inventory under this manager's control appears as an asset in the large business unit's C.V.A. or E.V.A. Thus, the business unit manager with P.& L. and asset responsibility will have an incentive to minimize the amount charged to the unit for capital employed and, therefore, will craft measures incentivizing the inventory manager to avoid having excess inventory.
Conclusion
The search for the ideal value proxy has been going on for decades and will surely continue in the years ahead. Net earnings, return on equity, return on assets and now economic value added have, in turn, been the preferred measures. There is little debate that value creation is the ultimate objective of the business corporation. The difficulty is in developing a framework for accurately assessing value creation at different operating levels and in using value creation to guide the behavior of different groups in the organization.
Thorough analysis of their businesses using C.V.A. and E.V.A. can help executives move their organizations one step closer to that ultimate objective of creating shareholder value.
Calculating Economic Value Added
Economic value added is aftertax operating profit less the cost of capital employed in generating that profit. Or:
Net operating profit after taxes (Nopat)
(Cost of capital x Capital employed)
= Economic value added
Economic value added can be calculated for an entire business or for its business units. Nopat, although based on accounting figures, includes adjustments to make it approximate the aftertax cash generated by the business that is available for reinvestment in the business or for distribution to the capital providers.
At the Coca-Cola Company, where E.V.A. is now being used for decision-making and performance evaluation at all levels, adjustments are made to remove factors over which operating managers have little or no control: interest income and expense, gains and losses on currency exchange, headquarters expenses and so forth. These are allocated to corporate units. Likewise, capital employed must reflect the actual amount of capital, including working capital and fixed assets, attributable to the operating unit.
Companies often make a number of adjustments to correct for anomalies created by generally accepted accounting principles, resulting in a Nopat that is closer to true economic earnings. While accounting rules require companies to expense all research and development costs even though they are more properly thought of as investments in future products, a Nopat adjustment might capitalize R&D outlays and amortize them over five years.
Once the operating unit's capital is determined, it can then be charged an appropriate cost. In most cases, this is the company's weighted average cost of capital -- a blending of the cost of equity and the cost of debt. For example, if a division of a particular corporation is found to be using $20 million in capital, and the corporation's cost of capital is 12 percent, the division is charged $2.4 million. Ideally, some adjustment to cost of capital should be made for the riskiness of the operating unit, which may be different from that of the corporation as a whole.
How Companies Use E.V. A.
Strategic Direction.
I.B.M. applied economic value added to evaluate the strategic plans for key Latin American markets such as Mexico, Brazil and Argentina.
At Georgia-Pacific, the strategic focus shifted from profit creation to value creation.
Acquisitions.
In one of the largest acquisitions in recent years, AT&T used E.V.A. methods in deciding on its $12.6 billion purchase of McCaw Cellular.
The Ball Corporation rejected the acquisition of an Eastman Kodak unit because it failed the economic value added test for creating value. Heekin Can Inc. did pass the test, and was acquired.
Operational Improvements.
Briggs & Stratton recognized that its return on capital was poor and trending lower. Operations were restructured and economic value added was adopted as a way of focusing managers' attention on how they were employing capital. E.V.A. is now the firm's benchmark for product introductions, equipment purchases, supplier arrangements, quality initiatives and process improvements.
Harnischfeger uses economic value added to make decisions with respect to production sourcing and receivables as well as inventory management.
Product Line Discontinuation.
Economic value added helped Coca-Cola identify and sell businesses that failed to recoup their cost of capital.
The Perfect Data Corporation and Incstar both discontinued unprofitable product lines based on economic value added analysis.
Working Capital Focus.
Quaker Oats used economic value added to account for the large dollar amount tied up in finished goods and packaging materials inventories.
Morrison Restaurants uses economic value added to focus on management of its receivables.
Cost of Capital Focus.
Dow Chemical used economic value added to shed light on what it cost to run its businesses and return a positive economic profit.
Deere & Company is using economic value added to focus management on the value drivers of its businesses and the true cost of its asset base.
AT&T changed its focus from income statement earnings to a broader view that included the balance sheet.
Incentive Compensation.
At Transamerica, 100 percent of the annual bonuses for the C.E.O. and the C.F.O. are based on economic value added.
The compensation of supervisors and managers above a certain salary level at Coca-Cola is linked to economic value added. Half of their long-term compensation is based on E.V.A.
An E.V.A. Primer
Lesson 1: E.V.A.'s simplicity is deceptive. Make only those adjustments necessary to reflect an accurate picture of value creation. Yet, for it to be done correctly, complex adjustments may be required.
Lesson 2: Care must be exercised in making E.V.A. comparisons between companies because there are no strict guidelines that all firms follow.
Lesson 3: When all adjustments are made, E.V.A. and discounted cash flow lead to identical results.
Lesson 4: By capitalizing large expenses, E.V.A. smoothes fluctuations in annual measured performance.
Lesson 5: For any value measure, risk analysis should precede the adoption of a single company-wide cost of capital.
Lesson 6: Cost of capital and hurdle rates should change with significant changes in the cost of money. Failure to make these changes reduces the power of both D.C.F. and E.V.A.
Lesson 7: Communication of the use and benefits of E.V.A. is crucial to obtaining internal and external support.
Lesson 8: A value creation grid analysis matches a company's needs with the most appropriate performance measure.
Lesson 9: A flexible, multifaceted performance measurement system provides incentives, rewards performance and creates value. ![]()
Reprint No. 97404
The authors would like to thank Olga Santoro for her extensive research assistance, Steve Kempainen for his computational support and Richard Leucke for his guidance and editorial input.
