“It’s Time for a Change”
CEO turnover is trending high, but in a more planned and stable manner.
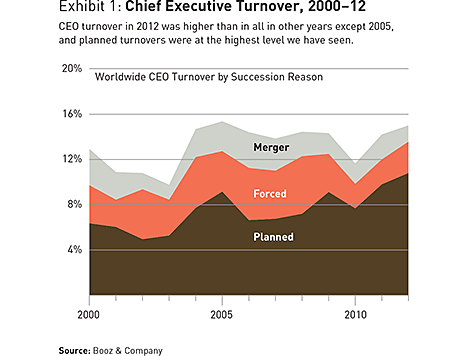
The past year was a busy one for companies looking for new leaders. Fully 15 percent of the world’s 2,500 largest public companies made a change at the top in 2012. This number, 375 companies, was the highest total since 2005, and the second highest in the 13 years’ worth of data we’ve gathered since 2000. Given all this turnover activity, you might expect higher levels of chaotic, reactive behavior. But almost three-quarters of the companies planned their succession events carefully, an increase of more than 50 percent since 2006.
The 2012 Chief Executive Study Overview Video
Additional insights from the authors on this year’s unprecedented number of planned turnovers and on who the incoming CEOs are. For more from the 2012 Chief Executive Study, click here.
These numbers represent a sharp contrast to the succession activity during the depths of the Great Recession; in 2010, for example, the rate of turnover was only 11.6 percent (see Exhibit 1). In other words, these results suggest that companies have moved toward more overall leadership stability, not less, in the past few years. Companies in general may be more willing to make changes at the top deliberately, in a more systematically planned fashion, in search of increased competitive advantage rather than recovery from a crisis. Whether these choices prove to be the right ones is harder to judge, of course, but if experience is any guide to future results, the attention to planned succession will pay off.
Insiders and Outsiders
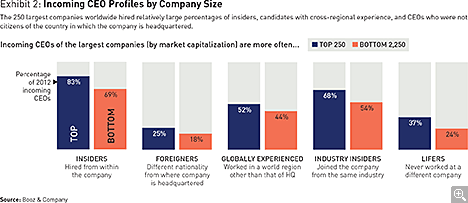
Another indicator that companies were looking for real change in 2012 was the proportion of CEOs hired from outside the company. Overall, the 2012 crop of new CEOs included a larger percentage of outsider recruits than past years did. The share of new insider CEOs dropped considerably, from an average of 80 percent between 2009 and 2011 to just 71 percent in 2012. A full 30 percent of companies that made a planned change in their CEO hired an outsider in 2012, compared with an average of just 18 percent in the previous three years. Meanwhile, the number of outsiders brought in as a result of forced changes stayed about the same as in 2009–11, at just under 30 percent.
Clearly, more companies feel sufficiently stable to take a risk on a leader they may not know well. But at the same time, they are carefully evaluating the potential risks that come with hiring someone from outside. And they may well be mitigating the risk by hiring outsiders from the same industry—just 44 percent of outsiders joined their new company from a different industry.
As in previous years, the size of the company correlated with different CEO succession patterns. Among the 250 largest companies with new CEOs, just 17 percent of CEOs were hired from outside the company, compared with 31 percent of their counterparts among the 2,250 smaller companies. This suggests that smaller companies were more willing to take a risk than their larger brethren (see Exhibit 2). Larger companies had a higher proportion (25 percent) of CEOs who came from a country different from where their headquarters were located. Smaller companies still tended to choose leaders from close to home—only 18 percent came from another country. The largest global companies also favored more CEO recruits with international experience (perhaps because of the opportunities a larger company can offer its insiders). Indeed, 52 percent of the new CEOs at large companies had experience in other regions, compared with only 44 percent from smaller firms.
Regional Differences
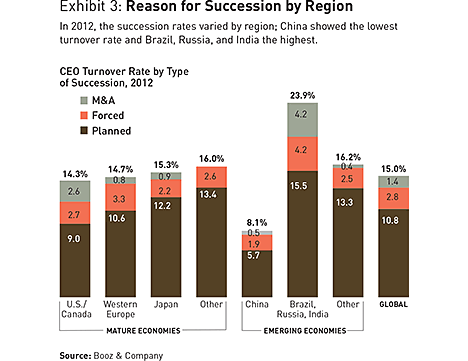
Significant differences in turnover rates were found depending on where companies were headquartered. The rates of CEO turnover among companies based in mature economies around the world all hovered around the overall average of 15 percent in 2012 (see Exhibit 3). But only 8.1 percent of Chinese companies brought in new CEOs last year, whereas almost a quarter of companies based in Brazil, India, and Russia chose new leaders.
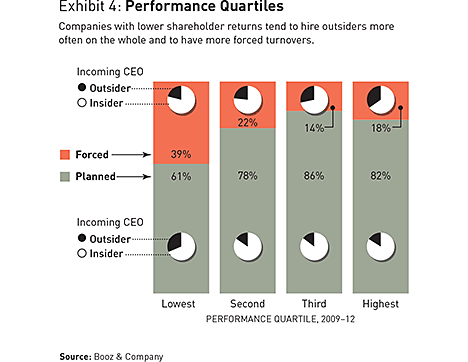
Unsurprisingly, financial performance also plays a role in the nature of CEO turnover events. Among companies that had a CEO turnover between 2009 and 2012 and were in the lowest quartile of performance as measured by total shareholder return over the outgoing CEO’s tenure, 39 percent had forced out their CEO, compared with just 18 percent among companies in the top quartile (see Exhibit 4). During the same period, companies in the bottom quartile also hired outsiders at significantly higher rates than the top-performing companies—27 percent versus 19 percent—no matter the cause for the change in leadership. Other analysis covering these years showed that in general, insider CEOs have led their companies to better overall returns.
All in all, our analysis of CEO turnover in 2012 among public companies makes clear two distinct and in some ways contradictory trends. On the one hand, companies in most geographies are more willing to make changes in their top leadership as they look for faster growth in a stabilizing economy and business environment. On the other hand, most companies, especially the better-performing ones, are planning those changes carefully, and sticking with insiders in hopes of maintaining their strong results. ![]()
Methodology
Booz & Company’s 2012 Chief Executive Study identified the world’s 2,500 largest public companies, defined by their market capitalization according to Bloomberg on January 1, 2012. Our research team members then identified the subset of those companies that had made a change at the top, and cross-checked the data using a wide variety of printed and electronic sources in many languages. We also used Bloomberg to determine which companies had been acquired or merged in 2012.
We investigated each company that appeared to have changed its CEO for confirmation that a change had occurred in 2012, and sought out additional details—title, tenure, chairmanship, nationality, professional experience, and so on—for both the outgoing and incoming chief executives, as well as any interim chief executives.
We accepted the information provided by the companies themselves on most data elements, except to confirm the reason for an executive’s departure. For that, we turned to outside press reports and other independent sources. Finally, Booz & Company staff around the world separately validated each succession event as part of the effort to learn the reason for specific CEO changes in their regions.
To distinguish between mature and emerging economies, Booz & Company followed the United Nations Development Programme 2012 ranking.
For data on the companies’ total shareholder returns during a CEO’s tenure, we also turned to Bloomberg, and included reinvestment of dividends, if any. We then adjusted that data to reflect differences in regional markets (measured as the difference between the company’s return and the return of the local regional index over the same time period) and annualized it.
Reprint No. 00183
Author profiles:
- Ken Favaro is a senior partner with Booz & Company based in New York. He leads the firm’s work in enterprise strategy and finance.
- Per-Ola Karlsson is a senior partner with Booz & Company based in Stockholm. He serves clients across Europe and the Middle East on issues related to organization, change, and leadership.
- Gary L. Neilson is a senior partner with Booz & Company based in Chicago. He focuses on operating models and organizational transformation.
- Also contributing to this article were Booz & Company senior manager Josselyn Simpson and specialist Jane Kim, and s+b contributing editor Edward H. Baker.


