Smart Spenders: The Global Innovation 1000
Booz Allen Hamilton’s annual study of the world’s 1,000 largest corporate R&D budgets uncovers a small group of high-leverage innovators who outperform their industries.
What does Dentsply International, a midsized manufacturer of dental products in York, Penn., have in common with Kobe Steel, a Japanese metals producer? What qualities are shared by Cadbury Schweppes, the European candy and beverage company; Tata Motors, the up-and-coming Indian automaker; and Google, the superstar of Silicon Valley? What links Caterpillar, the leviathan of earthmoving equipment, with Apple, the nimble conjurer of the iPod Nano, and Adidas, the German purveyor of sportswear? What does Toyota have in common with Christian Dior?
 |
|
Photograph by Chris Callis |
The answer: All these companies spend less than their competitors on research and development, yet outpace their industries across a wide range of performance metrics. They are among the world’s “high-leverage innovators,” a select subset of the Booz Allen Hamilton Global Innovation 1000, our annual roster of companies that spend the most on research and development worldwide. As different as they are from one another, these 94 smart spenders have one thing in common. They get more bang for their R&D buck than their peers, even their highly innovative peers. And they have managed to do so consistently over a five-year period. They may not develop the highest number of new products or services, but they consistently reap the greatest financial reward from every dollar they invest in R&D.
Now in its second year, the Global Innovation 1000 study is the most comprehensive effort to date to assess the influence of R&D on corporate performance. Last year, our in-depth analysis — studying the 1,000 companies that reported the most spending on research and development around the world in 2004 — demonstrated that there is no simple relationship between the level of R&D spending and corporate performance. This year, the data reinforced that conclusion and extended it, with a new understanding of innovation practices and additional metrics (such as the number and quality of patents). Among the specific findings:
-
Deep pockets can be dry wells. Analysis of the 2005 Global Innovation 1000 confirms the major finding from our initial study last year: Money simply cannot buy effective innovation. There are no significant statistical relationships between R&D spending and the primary measures of financial or corporate success: sales and earnings growth, gross and operating profitability, market capitalization growth, and total shareholder returns. Gross profits as a percentage of sales is the single performance variable with a statistical relationship to R&D spending.
-
Less than 10 percent of companies are high-leverage innovators. Compared with others in their industries, only 94 of the companies in the Global Innovation 1000 produced significantly better performance per R&D dollar over a sustained period.
-
Companies are getting better at squeezing benefits from R&D spending. R&D spending by the Global Innovation 1000 rose last year by more than $20 billion, but revenues rose more.
-
Bigger can be better, even if it doesn’t boost breakthroughs. Scale provides advantages to R&D spenders. For the largest 500 companies, ranked by revenue and indexed by industry, median R&D spending was only 3.5 percent of sales in 2005, compared with 7.6 percent for the 500 smallest firms.
-
Patents generally don’t drive profits. Boosting R&D spending can increase the number of patents that a company controls, but there is no statistical relationship between the number or even the quality of patents and overall financial performance.
-
Masters of the innovation value chain have an edge. The high-leverage innovators and the companies with best overall performance distinguish themselves not by the money they spend, but by the capabilities they demonstrate in ideation, project selection, development, or commercialization.
Conventional wisdom often seems to view R&D as a predictable black box that automatically translates today’s innovation investments into tomorrow’s profits, even if nobody quite understands how it works. The principal findings from our study — both this year and last year — may undermine some people’s faith in innovation as a financial savior; however, they comport with the real-world experience of most corporate decision makers, as well as with the lessons of business history. Innovation often does lead to higher performance, but the process isn’t automatic. Many companies’ R&D efforts are unfocused. Money is wasted “reinventing wheels” that others have already rolled out. Good ideas get stuck in developmental bottlenecks. And promising innovations never get to market because of flawed understanding of customers’ needs, and poor marketing and investment planning.
In this year’s study, we systematically set out to find which companies have been getting R&D spending right, and then to identify their common attributes. To do this, we analyzed financial data for the Global Innovation 1000 using seven performance screens — sales growth, gross margin percentage, gross profit growth, operating margin percentage, operating income growth, total shareholder returns, and market capitalization growth — from 2000 through 2005. We chose five years as an appropriate time horizon for measuring the effects of R&D expenditures. That may seem short for basic research, but the full life cycle for a single innovation in most industries is five years or less. That’s because only about 15 percent of corporate R&D spending goes to research; the rest is spent on development and commercialization, which have much shorter time frames.
Analysis of the performance screens revealed that 94 companies within the Global Innovation 1000 — our high-leverage innovators — consistently outperformed their peers over the five-year period, while spending less on R&D as a percentage of sales than their industry median.
How did they do it? There’s no silver bullet; we found examples of many different models and approaches. If these high achievers have one thing in common, it seems to be a focus on building multifunctional, company-wide capabilities that can provide them with sustainable competitive advantage. They design their innovation investment for the long run, and create superior growth and profitability over time.
Bucks versus Bang
Each year, Booz Allen studies the world’s largest corporate R&D spenders to better understand how companies can maximize their return on innovation investment. We rank the 1,000 publicly traded corporations worldwide that spend the most on research and development as reported in their most recent annual financial statements. Private companies, and those public companies that do not disclose R&D spending (including most financial-services companies and retailers), are thus excluded from the Global Innovation 1000. (See “Methodology” at the end of this article.)
The 1,000 companies on this year’s list spent a combined $407 billion on innovation in 2005, compared with $384 billion spent by the top 1,000 spenders in 2004. Altogether, for the companies included in the top spenders since 2000, R&D spending has grown 4.2 percent annually.
Global R&D spending is highly concentrated among the top 1,000. The next 1,000 companies together spent a mere $25 billion in 2005. We estimate that the Global Innovation 1000 accounts for about 85 percent of total global corporate R&D spending, and 55 percent of all R&D spending, including government and not-for-profit R&D. (See “Profiling the Global Innovation 1000,” below.)
|
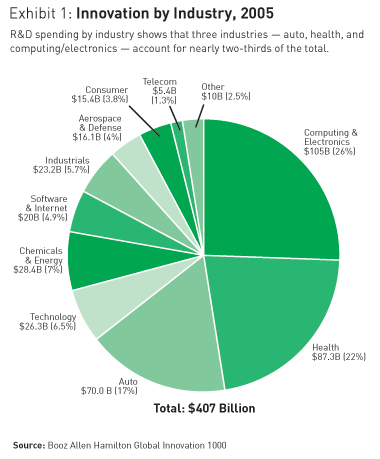
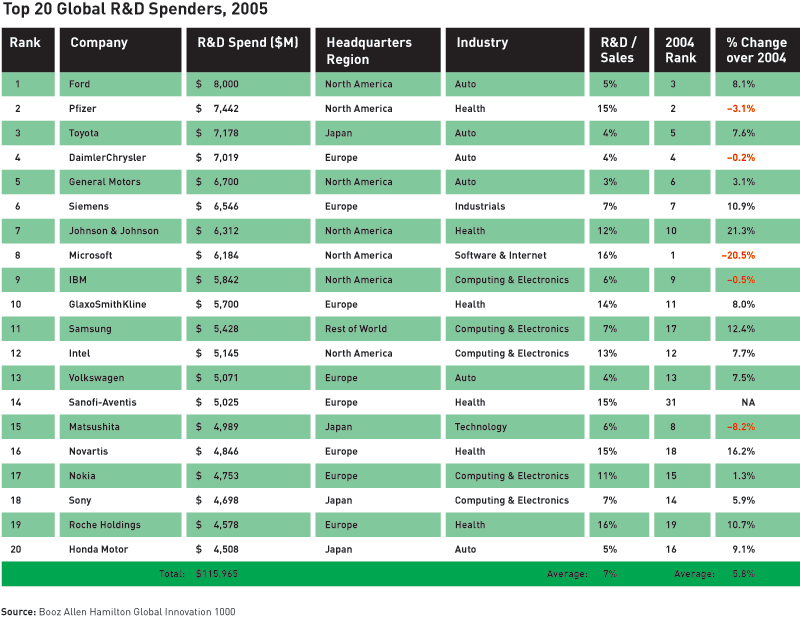
The Global Innovation 1000 companies spent a total of $407 billion on research and development in 2005, up 6 percent from 2004 — an amount bigger than the combined GDP of Denmark and Norway and roughly equivalent to the budget of the U.S. Department of Defense. The number one spender on R&D in 2005 was the Ford Motor Company, with a budget of $8 billion; number 1,000 was the Makita Corporation, a Japanese maker of power tools with a budget of $42.6 million. Spending is highly concentrated among the largest companies: The 20 largest R&D spenders accounted for $116 billion, or 28 percent, of the Global Innovation 1000 total. This year, 164 new companies moved onto the list, accounting for 6.3 percent of total R&D spending. Of the 164 companies that exited, 35 were acquired by larger companies on the list; the rest were supplanted by other companies that spent more. The median of R&D as a percentage of sales for the Global Innovation 1000 was 3.84 percent in 2005, and has slowly but steadily declined from 4.09 percent in 2001. Most of this decline, it appears, can be explained by the increase in size of the average Global Innovation 1000 company: $10.5 billion in sales in 2005 vs. $8.5 billion in 2001. Larger companies generally spend a smaller percentage of sales on R&D than do smaller companies. Industry Breakdowns
The R&D-to-sales ratio, as shown in Exhibit 2, illustrates the importance of innovation to an industry or enterprise — and shows the huge variations in this measure. Health companies were the most intense R&D spenders in 2005 (displacing the software category from the number one position that it had occupied in 2004), with a median ratio of 11.2 percent. At the other end of the scale, chemicals and energy companies spent a median 1.1 percent of sales revenues on R&D.
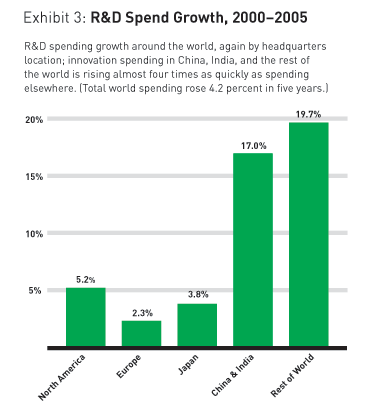
Regional Breakdowns But even with that unavoidable distortion, the spending mix shifted somewhat this year, with slight declines in Japan and North America, and a significant increase in the “rest of world” category, from 2.9 percent in 2004 to 4.6 percent in 2005. This last category includes Australia, Brazil, Singapore, South Africa, South Korea, and Taiwan; the biggest growth came from South Korea and Taiwan. As shown in Exhibit 3, spending has grown most rapidly over the last five years in India, China, and the “rest of world” countries.
The overall trend is clear: R&D spending is becoming much more international. A survey conducted in May 2005 by Booz Allen and INSEAD indicated that only one-third of R&D sites are still located in companies’ home countries, down from 55 percent in 1975. |
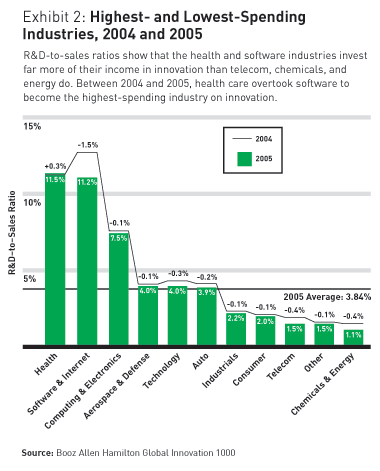
We used the ratio of spending to sales (the percentage of a company’s revenue spent on R&D) to meaningfully compare the amount that companies spent over time. We looked for cause and effect over all possible time horizons, performing approximately 10,000 analyses, matching our seven financial metrics against such factors as industry categories and corporate locations. Our analysis of the 2005 data confirmed the main finding from last year’s study of 2004 data: There is simply no statistical relationship between the performance bang and the R&D buck.
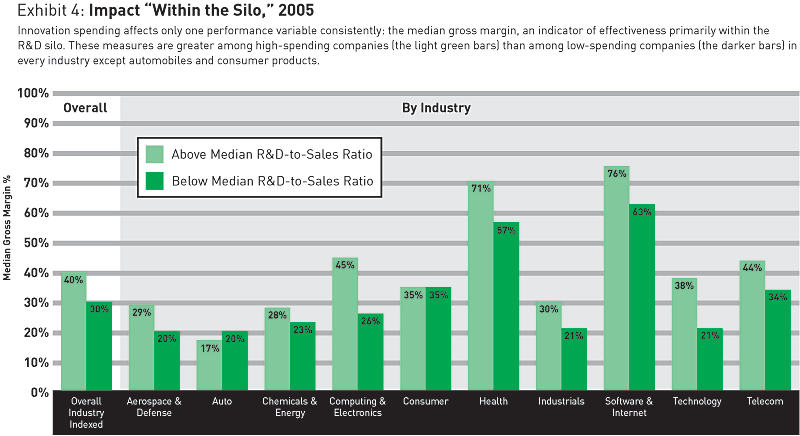
The single measure for which a relationship between R&D expenditures and corporate performance can be statistically demonstrated is gross margin — gross profits as a percentage of sales. The 500 companies that have the highest rates of R&D spending as a percentage of sales are more likely than other companies in their industries to achieve superior gross margins. (See Exhibit 4.) This makes sense, because gross margin measures the direct profit from sales after product costs such as materials, labor, manufacturing, and direct shipping. It is thus the financial performance measure most directly influenced by a company’s R&D operation. Researchers who study innovation estimate that 70 to 80 percent of the final unit cost of a product (the cost reflected in gross margin) is driven by R&D-based design decisions — for example, product specifications, the number and complexity of features in a device, the choice of standardized or customized parts, or the selection of manufacturing processes. This correlation of R&D spending and gross margin shows that in many companies, the R&D silo has succeeded in its narrow goal: creating a lower-cost offering that thus yields a wider margin, or a more differentiated offering for which a higher price can be charged.
Unfortunately, for most companies — and for the Global Innovation 1000 overall — the financial value of fatter gross margins is not ultimately captured, presumably because it is eroded in the marketing, sales, operational, and administrative work required to bring the product to market. Success thus requires a cross-functional strategic approach to innovation: building a value chain that integrates R&D more effectively with marketing, sales, operations, and cost management.
Patents and Scale
R&D spending does relate statistically to the number of patents granted, across all the industries we studied. However, when we compared the results of our analysis of the Global Innovation 1000 companies with data from ipIQ, a technology analysis firm known for its comprehensive patent database, we found no statistical relationship between financial performance and either patent counts or patent quality. (To compile its patent quality ratings, ipIQ tracks such measures as the number of citations in the scientific and technical literature.) Evidently, as in the case of gross margin, more R&D spending can lead to more innovation activity, but it doesn’t necessarily create more valuable innovations.
Public officials often fixate on the number of patents issued as a proxy for national innovativeness, but our finding that patents don’t relate statistically to financial performance implies that quantity is a misleading measure. One reason is that very few patents are truly significant — just as only a handful of the hundreds of thousands of books published each year become bestsellers. Moreover, many important innovations don’t involve new patents. (Television technology, for example, is still based on patents from the first half of the 20th century.) Value is created by effectively combining new or existing patents with the ability to recognize and fulfill customer needs.
There is also a relationship between company size and R&D investment: Companies above the median in sales tend to spend a smaller proportion of sales on R&D than do the smaller companies. (See Exhibit 5.) Moreover, the lower R&D-to-sales ratios of the large companies don’t seem to hurt them. Their performance on such measures as sales growth, profitability, and market value growth is statistically indistinguishable from that of the smaller, relatively higher-spending firms.
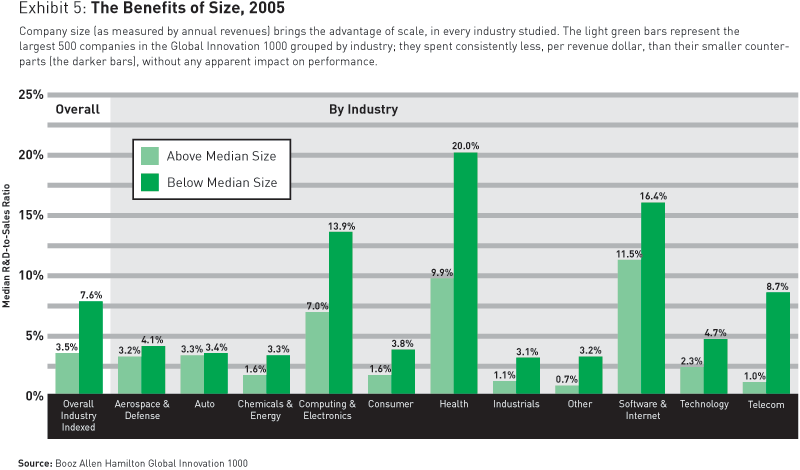
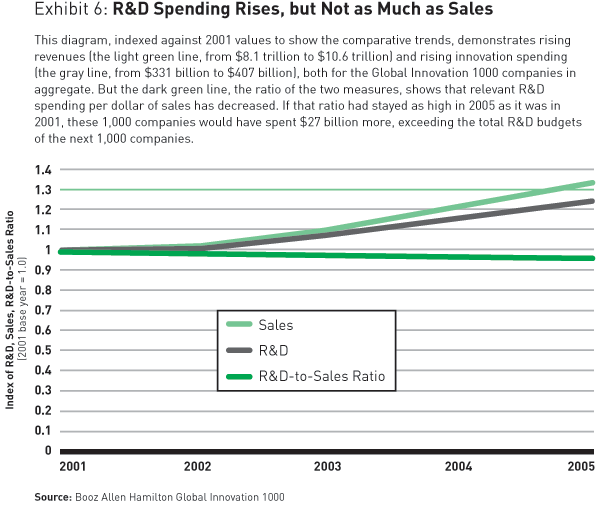
The overall impact of economies of scale helps explain one trend in the historical data for the Global Innovation 1000: Over the last five years, the median ratio of R&D spending to sales has declined steadily — from 4.09 percent in 2001 to 3.84 percent in 2005. (See Exhibit 6.) Although the percentage reduction seems small, it translates into a lot of money: The Global Innovation 1000 would have spent $27 billion more in 2005 if the ratio had held steady at its 2001 level — more than the total spent by the next 1,000 biggest R&D spenders. Much of this phenomenon can be explained by the increasing scale of companies around the world; the average sales of the top 1,000 R&D spenders increased from just under $8.1 billion to more than $10.5 billion in five years. But another reason is globalization: R&D is increasingly outsourced to facilities in lower-cost regions of the world. More than 75 percent of the new R&D centers that businesses plan to open during the next three years are to be located in China or India, according to a recent study by Booz Allen and INSEAD, the European graduate school of business. (See “Innovators without Borders,” by Kevin Dehoff and Vikas Sehgal, s+b, Autumn 2006.)
 Having a scale advantage is not the same as achieving high-leverage innovation — that is, maintaining consistently high returns per R&D dollar. Indeed, our study suggests that many large companies are not taking advantage of scale efficiencies and are therefore spending more on R&D, proportionately, than other companies that gain comparable financial impact. By the same token, smaller companies need to find ways to capture more benefits of scale virtually — for example, through partnerships that allow them to share investment costs, or through the development and use of global and cross-company innovation networks. They could thus spend less on R&D as a percentage of sales without impairing their financial performance.
Benefits from scale may also accrue to those who pool innovative activity with their neighbors — by extension, enhancing the competitiveness of a nation or locale. The best course for public policymakers interested in encouraging this kind of innovation is to focus government efforts on basic research so that companies can concentrate on development and commercialization. The public sector also has a role to play in helping smaller companies improve their innovation processes. One model in the U.S. is the Manufacturing Extension Partnership operated by the National Institute of Standards and Technology (NIST), which enables small and medium-sized firms to tap the knowledge of business experts, including innovation specialists.
The Integrated Value Chain 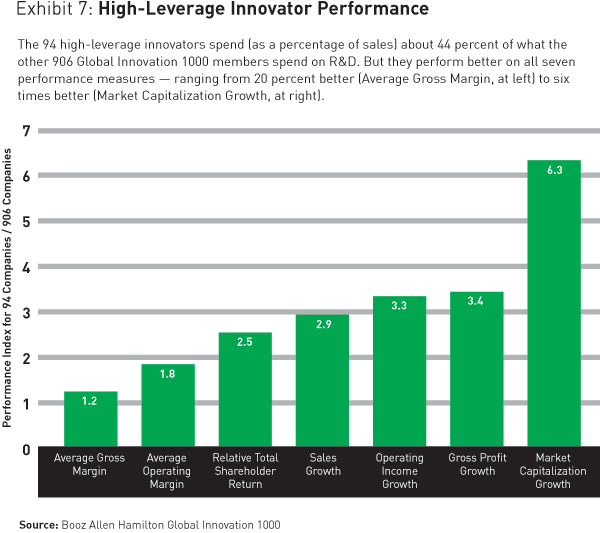 Despite the general lack of correlation between R&D and financial performance, we identified among the Global Innovation 1000 a select group: the 94 companies across industries that have found ways to consistently get better returns on their innovation investments. (See “High-Leverage Innovators,” below, for the complete list.) Each of these companies consistently outperformed the median in its industry from 2000 through 2005 across a wide range of performance variables — sales growth, gross margin percentage, gross profit growth, operating margin percentage, operating income growth, total shareholder returns, and market capitalization growth — while spending less than its industry median on R&D as a percentage of sales. (See Exhibit 7.)
|
These 94 companies, all members of the Global Innovation 1000 (and thus among the top spenders on R&D in 2005), also met the screens for “high-leverage” innovation. They outperformed their peers in our analysis of seven key performance measures: sales growth, gross margin percentage, gross profit growth, operating margin percentage, operating income growth, total shareholder returns, and market capitalization growth over a five-year period. These companies also spent less on R&D as a percentage of sales than their industry medians over the same five-year period. Finally, companies whose reported financial statistics were cast in doubt (through sustained legal or government challenges) were excluded from the list.
|
Although there is no single formula for innovation success, each of these high-leverage innovators has devised an R&D strategy that provides it with competitive advantage, and we found several common themes among their strategies.
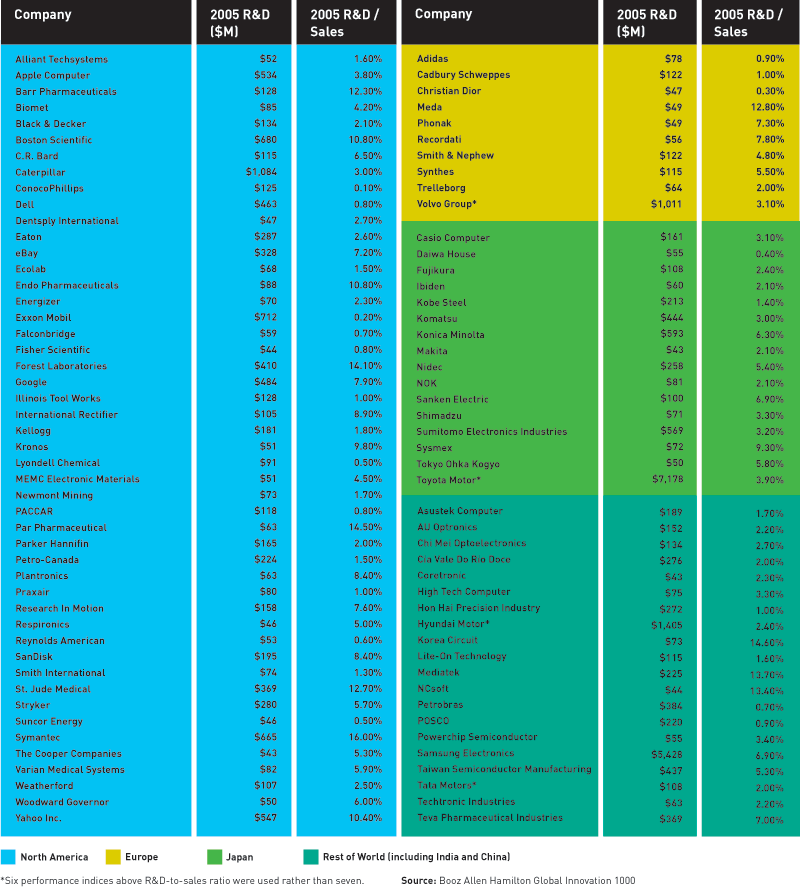
Consider the innovation process as a kind of value chain. (See Exhibit 8.) Each stage of the process becomes a platform on which the next stage can be built. Such a value chain would have four interdependent elements: the ideation process (basic research and conception), project selection (the decision to invest), product development (in tune with the rest of the organization), and commercialization (bringing the product or service to market and adapting it to customer demands). Based on press coverage and interviews with executives, we conclude that each of the 94 high-leverage innovators has built sufficiently strong capabilities in all four links of the value chain, and has seamlessly integrated them, to provide a high level of performance over time.
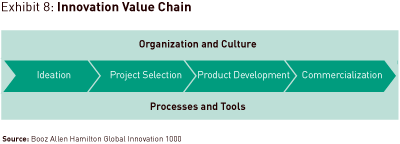
High-leverage companies are often famous for their skill in one particular stage, but a closer look shows that they reinforce that skill with competence at all stages of the value chain. Google, for example, excels at ideation. The search engine leader generates new ideas with blistering speed, in part because of what Google calls its “70-20-10 Rule”: Staff, especially engineers, are encouraged to spend 70 percent of their time on core business, 20 percent on related business, and 10 percent on areas entirely of their own choosing. Some ideas — such as Froogle (the shopping search engine), Orkut (the social network), and Google Finance — have moved more slowly at the development or commercialization stages than other ideas, but the integrated nature of the whole Google portfolio carries the momentum of ideation forward. Dentsply International, a manufacturer of dental products that generates $1.7 billion of revenue, also excels at ideation speed as a driving force for its innovation value chain. One of its goals is to introduce at least 20 products per year. But Dentsply also excels at bringing those ideas to market: In 2005, 43 percent of its revenues were derived from products introduced in the preceding five years.
Some high-leverage innovators are better known for their success on the latter part of the innovation value chain. Apple has well-honed capabilities in project selection and commercialization, backed by keen understanding of its customers. Caterpillar develops promising technologies through joint development projects and advanced technology consortiums with other businesses and the U.S. Department of Energy. Toyota has created competitive advantage by developing its products and processes faster and more efficiently than most other corporations do.
And on closer look, these three companies have systematic ideation processes, including the involvement of senior management (most famously in the case of Apple CEO Steve Jobs), in the conception and definition of new ideas.
High-Leverage Strategies
Many high-leverage companies apply distinctive approaches to innovation at all four stages. For example, from the ideation stage through project selection and product development, high-leverage innovators tend to prize end-user input. The Stryker Corporation, a $4.9 billion medical technology company headquartered in Kalamazoo, Mich., works closely in R&D with the surgeons and other medical professionals who use its products.
The Black & Decker Corporation’s innovation strategy is also heavily determined by end-users. “We’ve spent a lot of time focusing on where they work, where they play, where they buy, and where they learn,” says CFO Michael Mangan. “Understanding and developing those relationships really increases the efficiency of our new product introductions.”
At Illinois Tool Works Inc. (ITW) — a $3.7 billion maker of industrial fasteners and components based in Glenview, Ill. — many of the best product innovations “come from simple observation coupled with a keen understanding of our customers’ needs,” notes a company representative. This observation begins with an established program in which ITW engineers operate at customers’ plants or work sites.
High-leverage innovators generally favor flatter and nimbler management structures that make the innovation process more transparent to the executive team. Black & Decker keeps costs down partly by keeping R&D focused and closely aligned with its business units. Although worldwide design is coordinated from headquarters in Towson, Md., Black & Decker maintains no centralized R&D function.
Nor does Stryker. “All R&D activities are managed in our divisions,” says J. Patrick Anderson, vice president for strategy and communications at the medical technology company. “This allows us to target our R&D efforts to meet specific customer needs versus doing a great deal of early-stage, academic research.”
But decentralization is not a universal prerequisite for high-leverage innovation. Some high-leverage innovators manage the innovation value chain from the core, with an integrated company-wide strategy for ideation, development, selection, and commercialization. The SanDisk Corporation, the world leader in the super-hot market for flash memory and data storage cards, makes broad innovation investments at the core technology level to protect its position as a market leader. Its innovation program starts with ownership of key intellectual property. The company owns a patented flash memory technology that enables it to increase memory capacity on its chips, which provides a cost advantage to SanDisk and others who license the technology.
In the flash memory industry, prices fall 40 to 50 percent per year. Thus, at SanDisk, a small team of senior executives meets twice per week to monitor prices and market trends. Their awareness, fed back into the company’s innovation process, allows SanDisk to act quickly on new opportunities. In 2004, for example, the company realized that falling costs had created an opportunity for it to enter the market for MP3 audio players with a flash memory–based device. Management contacted an original equipment maker, defined design specifications, and delivered the new product to retailers’ shelves within six months. The SanDisk player is now number two in the market, after Apple. “We don’t have big planning and product committees,” says SanDisk Chief Financial Officer Judy Bruner. “Most decisions, even those involving huge capital commitments, are made pretty quickly by a small number of pretty visionary people.”
One factor helping SanDisk’s innovation efforts translate to bottom-line performance is the company’s frugal management culture. “We operate in a very lean way across the board,” says Ms. Bruner. In addition to holding R&D expenditures below the level of rivals’, SanDisk’s selling, general, and administrative (SG&A) spend is about 8 to 10 percent of revenue — much less than that of its key competitors.
Symantec, whose brands include the Norton line of security software and Veritas data storage and backup software, keeps its internal innovation engine running efficiently through a core engineering team that designs and develops a variety of product lines. “We have a large portfolio of products and business units,” says Ann Marie Beasley, vice president of strategy. “One of the key contributors to our R&D bang for the buck is that there’s a lot of common engineering and design, as well as actual code reuse.”
Symantec applies the same high-leverage logic to its acquisitions; it has made more than two dozen acquisitions in recent years, generally of leading innovators in adjacent markets that can complement the company’s distinctive position. Two years ago, according to Ms. Beasley, Symantec’s executive team became convinced that stand-alone security software products would become less viable as the industry consolidated and security and storage solutions converged. They concluded they needed a broader portfolio of products to compete. The result, completed in July 2005, was the company’s $13.5 billion acquisition of Veritas.
Corporate executives contemplating their R&D budgets in light of our Global Innovation 1000 study may recall John Wanamaker’s famous quip about advertising. He knew that half the money he spent was wasted; he just didn’t know which half. R&D spending can seem equally mysterious.
To solve the riddle and achieve high-leverage innovation, senior managers need to understand the entire innovation value chain in their business and identify an integrated process. “The global economy places greater value on economies of speed, scope and skill rather than simply economies of scale,” Sun Microsystems CEO Jonathan Schwartz wrote recently in the Financial Times. “This means innovation must be achieved by different departments and business units within the same organization working in parallel rather than in isolation as they often do in large corporations. It also means looking outside your organization to partners, suppliers and customers for new and innovative ideas.”
For most of the Global Innovation 1000 companies — those not among the 94 high-leverage innovators — our study implies that methodically building capabilities along the innovation value chain could generate significant improvements in return on research and development spending. Companies can pick the elements to generate this competitive advantage on the basis of their industry, competition, and internal capabilities. And as our high-leverage innovators show by example, this in turn can yield superior and sustainable overall financial performance.![]()
|
Top 20 R&D Spenders, 2005 |
|
Representing $116 billion, or 28 percent, of global innovation spending on R&D, the Top 20 companies are well-known multinationals headquartered in Europe, North America, and Japan. They have a median R&D-to-sales ratio of 7 percent, nearly 1.8 times that of the remaining 980 companies, reflecting the prevalence of health and computing firms as innovation leaders. The Top 20 increased their median R&D spending at a rate of 5.8 percent in 2005 — about average for the Global Innovation 1000 as a whole. Over the past five years, however, the R&D spending of the Top 20 has grown faster than spending at other companies in their industries (6.7 percent vs. 4.3 percent). Furthermore, their R&D-to-sales ratios are significantly higher (6.8 percent versus 3.8 percent). Only one company on this list, Toyota, qualifies as a high-leverage innovator by our criteria. As a whole, the Top 20 do not appear to be leveraging their scale advantage. They are spending on R&D at a higher rate than their competitors without capturing any corresponding performance gain.
|
|
Innovation in the Nonprofit Sector: |
|
Many nonprofits spend significant amounts on R&D, and although the metrics they use to measure performance are different from those of To gain insight into the nature of innovation investment in the nonprofit sector, we visited with the senior management of St. Jude Children’s Research Hospital in Memphis, Tenn. St. Jude (no relation to the company St. Jude Medical, listed on page 54) was founded in 1962 by the late entertainer Danny Thomas. It is widely recognized as an innovation leader in treating catastrophic pediatric diseases such as leukemia. The overall cure rate for childhood cancers is 70 percent today, up from less than 20 percent in the early 1960s, and St. Jude’s current goal is to raise that rate to more than 90 percent. The hospital spent $154 million on R&D in 2005, which would rank it 390th on the Global Innovation 1000 study if it were a publicly traded corporation. Innovation at St. Jude is intimately linked to delivery of service: The hospital provides treatment free of charge to thousands of children every year, and even reimburses their travel and living expenses. Unlike most research hospitals, which rely mainly on government funding, St. Jude receives more than 70 percent of its budget from charitable donations, raised by the American Lebanese Syrian Associated Charities (ALSAC), a Memphis-based group also cofounded by Mr. Thomas. Strategic decisions on R&D are made by St. Jude’s executive team and are based on an assessment of where the hospital can be most productive. This group recently decided, for example, to maintain its focus on childhood cancers, rather than allowing the hospital’s researchers — some 200 scientists who work in 17 different departments, such as biochemistry, hematology, and immunology — to broaden their research into fields such as Third World infectious diseases. “I think we can do things that other places can’t do because of our focused mission,” says Scientific Director James Downing. From Lab to Bedside But determining whether the scientific discoveries made by the faculty are developed is a core managerial decision. If a St. Jude scientist makes a discovery not closely aligned with the hospital’s mission — one, for instance, that might be useful in treating Parkinson’s disease — Dr. Evans says, “we don’t tell them not to work on it. But we do tell them that we’re not going to be the ones who translate that discovery to the bedside.” St. Jude is also an innovator in breaking down silo mentalities. The hospital has been designed so that employees in different disciplines — researchers, clinicians, pharmacologists, nurses, and geneticists — all work interactively and in close proximity. Conscious effort is made, says Dr. Evans, to cultivate people comfortable with cross-disciplinary collaboration “at all stages, in terms of who gets recruited, who gets promoted, and who gets rewarded.” One result is that St. Jude is recognized (and copied) for its skill at translating medical research into effective treatment, a challenge at research institutions where scientists and clinicians tend not to communicate much with each other. Dr. Evans says, “Translational research — taking a discovery in the basic science of a disease and translating that into better treatment or a better diagnostic — has become a buzzword, but it’s the way we’ve been thinking about childhood cancer for a long time.” Bets and Metrics The bottom line for a nonprofit research hospital is different from that of a corporation. Instead of gross margin, net profit, and shareholder returns, St. Jude tracks such results as the decrease in mortality rates for specific diseases, the reduction in harmful side effects of treatments, and the number of times that studies by St. Jude researchers are cited in other research. “The most important thing we do every day is to provide unsurpassed care for kids who come here,” says Dr. Evans. “The most important thing we do for tomorrow is our research, which will change that treatment to something better. Innovation, in and of itself, is the ultimate product of this organization.” — B.J., K.D., R.B. |
|
Booz Allen Hamilton identified the 1,000 public companies around the world that spent the most on research and development in 2005 (companies for which public data on R&D spending was available). The last full-year data reported up to June 30, 2006, was considered the R&D spend for the company for 2005. Subsidiaries that were more than 50 percent owned by a single corporate parent were excluded because their financial results were included in the parent company’s reports. For each of the top 1,000 companies, we obtained key financial metrics for 2001 through 2005: sales, gross profit, operating profit, net profit, historical R&D expenditures, and market capitalization. All foreign currency sales and R&D expenditure figures prior to 2005 were translated into U.S. dollars according to the 2005 exchange rate. In addition, total shareholder return was gathered and adjusted for each company’s corresponding local market total shareholder return. Each company was coded into one of 10 industry sectors (or “other”) according to Bloomberg’s industry designations, and into one of five regional designations according to reported headquarters locations for each company. To enable meaningful comparisons across industries on R&D spending levels, we indexed the R&D spending level for each company against the median R&D spending level for that industry. A similar approach was employed for financial metrics. Approximately 10,000 analyses were required to explore all combinations of regions, performance variables, and industries. |
Reprint No. 06405
Author profiles:
Barry Jaruzelski (jaruzelski_barry@bah.com), a vice president with Booz Allen Hamilton in New York, is the firm’s lead marketing officer. He concentrates on corporate strategy, organizational transformation, and time-to-market improvement for companies in high-technology industries and manufacturers of highly engineered products.
Kevin Dehoff (dehoff_kevin@bah.com), a vice president with Booz Allen Hamilton in New York, is the global leader of the firm’s innovation service offering. He has spent more than 15 years helping clients improve efficiency and effectiveness in product development.
Rakesh Bordia (bordia_rakesh@bah.com) is a principal with Booz Allen Hamilton in New York. He specializes in improving innovation effectiveness and efficiency for clients in engineered products industries.
Also contributing to this article were Booz Allen Hamilton Vice President Alexander Kandybin and Associate Owen Ward, and Rob Norton.