Beyond Borders: The Global Innovation 1000
This year’s annual Booz & Company study of corporate R&D spending reveals, for the first time, where in the world the money is being spent — and why.
As business becomes increasingly global, corporate innovation strategies are becoming more global as well: Multinational companies are spending a significant — and growing — share of their research and development money outside the countries in which they are headquartered. Booz & Company’s annual Global Innovation 1000 study found that in 2007, the top 80 U.S. corporate R&D spenders deployed an estimated US$80.1 billion of their $146 billion R&D funds overseas. The top 50 European companies spent $51.4 billion of their $117 billion total outside the continent. In Japan, the top 43 Japanese firms exported $40.4 billion of their total $71.6 billion to other countries.
 |
|
Illustration by Bryan Christie |
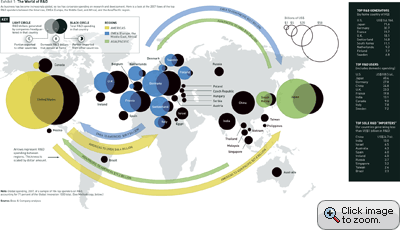
At first glance, observers might think that this represents a loss of jobs, intellectual power, and influence for the home countries of these companies. But innovation spending seems to flow in both directions at once. Even as the companies based in the U.S. performed $80.1 billion worth of R&D in other countries, companies headquartered elsewhere poured $42.6 billion into R&D conducted in the U.S. (See Exhibit 1.) In fact, 40 percent of the money spent on R&D in the U.S. is spent by companies headquartered elsewhere. The total amount of R&D spending in the U.S. is 2.7 times as great as in Japan, whereas the spending generated by companies headquartered in the U.S. is only two times as great. Moreover, companies that invest wisely in a multinational innovation footprint are gaining far better returns on their R&D investment than companies that exclusively keep their laboratories at home — or that fragment them across a wide variety of locations.
The study found that the Global Innovation 1000 companies are spending an average of 55 percent of their innovation dollars outside their home country, demonstrating how international the practice of innovation has become over the past several decades. All the biggest companies are now multinational, and their R&D footprints reflect the need to succeed in the global economy — to compete against nimble and fast-growing local and international operators, win share in unfamiliar new markets, understand the customers in those markets, recruit talented scientists and engineers, and capture the best ideas from around the world. Fully 91 percent of this year’s Global Innovation 1000 already conduct innovation activities outside the countries in which they are headquartered.
This year’s study is the fourth of our annual analyses of corporate spending on innovation and its effect on corporate performance. As in previous years, we identified the 1,000 public corporations worldwide that spend the most on researching and developing products and services for their marketplaces. Those 1,000 companies spent a total of $492 billion in 2007 on R&D, a 10 percent increase over the prior year, and, once again, we found no statistically significant evidence that higher levels of spending guarantee better results. Geographically, global R&D would seem at first to be centered in the United States, Europe, and Japan; companies headquartered there made up 94 percent of the total in 2007, down just one percentage point from the prior year.
But that geographic distribution hides a trend we have long been aware of: More and more companies are conducting critical R&D outside their home countries. Thus, this year, we took on two new questions: How far have major multinational corporations gone in globalizing their R&D footprint? And, What is the effect of the globalization of corporate R&D on performance? In addition, we looked in depth at the globalization experience of the three industries that lead in total R&D spending: auto, health care, and computing and electronics (C&E). The results have much to say about the globalization of business and the innovation engines that support it.
The globalization of R&D is not new; companies have been locating research and development facilities abroad for decades. IBM founded its first overseas research center, in Zurich, Switzerland, in 1956, and Japanese auto companies have had design studios in the U.S. since the 1960s. The share of R&D facilities located outside the home markets of multinational corporations, however, has been rising steadily — from 45 percent in 1975 to 66 percent in 2005, according to a 2006 study conducted jointly by Booz & Company and INSEAD. That share continues to increase: Between 2004 and 2007, global multinationals increased their total R&D sites by 6 percent, and of those new sites, 83 percent were in China and India. They also increased R&D staff by 22 percent; 91 percent of that increase was in China and India.
To gain further insight, we closely examined the global innovation footprints of the top 100 R&D spenders, along with the top 50 companies in each of the three highest-spending industries: auto, health care, and computing and electronics. The 184 companies in this group support more than 3,400 facilities in 47 countries around the world. Together, they spent more than $350 billion on R&D in 2007. That amounts to 71 percent of the total spend of the Global Innovation 1000 and 57 percent of all private-sector R&D spending. On average, just 45 percent of these companies’ total R&D spending occurred inside their home countries.
Judging by our sample, companies in the U.S. spent the largest amount on R&D in other countries, making the U.S. the top “net exporter” of R&D spending in 2007, followed by Japan and Switzerland. When the numbers are adjusted for the overall size of the countries’ economies, however, the U.S. falls to sixth place in the ranking of net exporters of R&D investment. The top “net importer,” by a long shot, is China, where $24.7 billion in R&D spending was accounted for by foreign companies, with product development activities now following the numerous manufacturing sites established there. India was the second-largest, with $12.9 billion in net imports; its large, English-speaking talent pool and fast-growing auto, computing and electronics, and pharmaceutical markets will certainly stimulate further growth. Other top net importers included Canada, Israel, and the United Kingdom.
Although we use the terms exporting and importing as convenient shorthand for describing the flow of R&D money around the world, these terms have limited usefulness and can easily be misunderstood or misused. When economic nationalists and opponents of globalization look at innovation flows, for example — particularly in Europe and the United States — they see only the “export” of high-paying science and engineering jobs to low-cost countries (LCCs) in the developing world. Our analysis, however, suggests that cost reduction is not the most important of the several reasons that multinationals are moving their R&D facilities abroad. Furthermore, it is receding in significance. The underlying reasons are more complex and multifaceted. They include:
• Lower costs. To be sure, the initial impetus for conducting research and development overseas was often to save money, in part by replacing higher-paid “home-country” engineers with lower-paid replacements in LCCs. But our analysis shows that lower engineering labor rates explain only one-third of the move to site R&D facilities overseas. Labor costs are rising rapidly in many LCCs as demand for skilled engineering and other talent grows. In India, for example, the wage rate for high-end service workers was 53 percent of the equivalent rate for U.S. workers in 2005. In 2008, the percentage had risen to 65 percent, and it is projected to rise to 77 percent in 2012 and 90 percent in 2020.
• Access to talent. As the advantage of low-cost labor erodes, other reasons for investing in global R&D have become more prominent. Many companies are heading overseas in search of access to the burgeoning numbers of talented engineers and scientists around the world, and to the ideas that they are generating. The number of skilled engineers is increasing rapidly, not just in India and China but in many other countries, and their importance at every stage of the innovation value chain — from ideation to research to product development and testing — is growing. Global companies are learning quickly that specific countries are gaining specific skills (automotive engineering in India, electronics in China), and they are chasing that talent accordingly.
• Market proximity and insight. As companies sell their products and services in markets around the world, they find it valuable to site R&D closer to those growing markets. The automotive industry is a case in point: The demand for cars is rising rapidly in developing countries. Consumers in such markets aren’t looking for the sorts of cars that sell well in the U.S. or Europe — in part because they can’t afford them. But they don’t want cheaply built cars either; they want high-quality, low-cost cars. Selling successfully in these new markets requires the engineering talent to rethink the design of cars for these markets. And that understanding and talent is harder to come by in Detroit or Stuttgart than in Shanghai or Mumbai.
The Performance Payoff
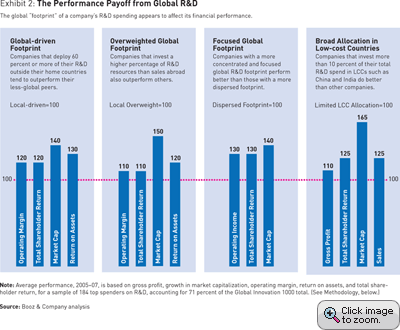
Overall, our analysis suggests that companies taking a more aggressive posture in globalizing their R&D footprint enjoy stronger sustained financial performance. Of the 184 top spenders that we studied closely, those that deployed more than 60 percent of their R&D outside their home countries tended to perform better, over the past three years, on several performance indicators, including operating margin, total shareholder return, market cap growth, and return on assets. These results indicate that for these companies there is a payoff from greater deployment of capabilities and capacity on a global scale, and greater success in serving local market needs. (See Exhibit 2.)
The same holds true for the companies we studied that are working to ensure that their R&D footprints are more global than their sales footprints — those whose percentage of research and development resources invested overseas is higher than their percentage of sales overseas. Indeed, for such companies, three-year market cap growth was 50 percent higher than for those who underinvest globally.
However, not all global innovation strategies are created equal. An international footprint for R&D, in itself, is no guarantee of improved performance. To succeed, companies must develop R&D strategies that are carefully aligned with overall corporate strategy and appropriate for the business environments in which they operate. Then they must execute those strategies through careful management of their far-flung R&D empires. Companies that approach their innovation footprint this way tend to perform better on a variety of performance indicators.
A network of fewer, larger R&D facilities seems to support stronger performance results. The companies in our sample with a more concentrated and focused global R&D footprint perform 30 percent better on three-year operating income growth and total shareholder return, and 40 percent better on three-year market cap growth. Because these companies deploy their R&D energies more carefully, they can make better use of resources, manage their R&D networks more effectively, and improve communications and collaboration. They also take advantage of economies of scale to leverage critical factors such as training, IT support, and lab facilities. Indeed, we have noted in our work with multinational clients that attempts to conduct R&D with complex teams at multiple sites can be problematic if the right IT infrastructure, communication processes, and training programs are not in place. At one company we studied, for example, the cumulative churn of product requirements for development execution increased from 23 to 54 percent as the number of locations participating rose from one to four, and multisite projects overran planned budgets by more than 20 percent.
Finally, if somewhat unsurprisingly, companies that invest more than 10 percent of their total R&D spend in LCCs such as China and India do better — 25 percent better on three-year sales growth, and as much as 67 percent better on three-year market cap growth. Clearly there is still some money to be saved by arbitraging labor costs, even among the highly skilled engineers needed for complex corporate R&D projects. Yet just as important is the knowledge gained about how to better serve those fast-growing local markets.
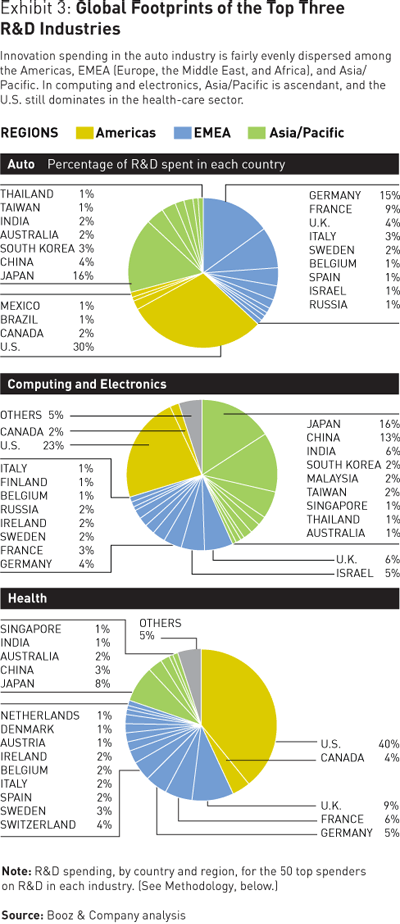
For every company, in every industry, the decision to globalize R&D activities involves a combination of business strategies designed in response to specific business needs: cost reduction, attraction of talent, access to markets and market insight, and operational improvement. Companies in the three industries that together represent nearly 70 percent of all global R&D — auto, computing and electronics, and health care — face their own set of innovation footprint challenges, revealed by our data and in interviews with key executives. (See Exhibit 3.)
Auto: Driven by Demand
The auto industry was the third-largest spender on R&D in this year’s study. The 72 auto companies with the highest level of R&D spending had revenues of $2 trillion in 2007, and spent $79 billion on R&D. That was up 8 percent over the year before, and made up 16 percent of total corporate spending on R&D.
Thus the auto industry spent 3.9 percent of sales on its R&D efforts in 2007, a level of the “intensity” of spending (R&D spending as a percentage of sales) just 0.2 percentage points above the average for the Global Innovation 1000 as a whole. That figure has risen over the past several years as the industry’s investments in new power trains have grown and its global R&D footprint has diversified significantly. Fully 83 percent of the industry’s 2007 R&D spending came from companies headquartered in just three countries — the U.S., Germany, and Japan — yet only 60 percent of total R&D spending took place in those three countries. The diversification of auto R&D suggests the importance of emerging auto markets to every auto company around the world.
Visteon Corporation, the U.S. auto parts maker, is one company that has seen the writing on the auto industry wall, and has reacted accordingly. In just the past eight years, since it was spun off by Ford Motor Company, the $11.3 billion company has been transformed by its newly global strategy. More than 90 percent of Visteon’s revenues once came from Ford. But after 2005, when the company sold a significant portion of its North American operations back to Ford, its geographic distribution became evenly divided among North America, Europe, and Asia. And now, the balance has tilted heavily overseas. In the first half of 2008, according to Asaf Farashuddin, Visteon’s vice president of corporate strategy, North American revenues made up just 25 percent of the total, the Asia/Pacific region made up 29 percent, and Europe made up 42 percent, with the rest coming from South America. The company’s global R&D footprint is even more heavily invested outside the U.S. than its revenue sources would suggest: Of its 18 R&D facilities worldwide, only three are in the U.S., whereas nine are in Europe, five are in Asia, and one is in Mexico.
“We expect our revenue diversification to continue — with less of our total revenue based in the traditional automotive markets in the coming years,” says Farashuddin. “By 2010, we expect Asia to be our largest region, with 37 percent of revenue, and Europe and North America to be less than 30 percent each.” Similarly, in 2005, just 19 percent of Visteon’s engineering took place in emerging markets; by 2007, that had grown to around 35 percent. “Five years from now, the majority of our engineering will take place in the emerging markets of the world,” Farashuddin says.
According to Farashuddin, this strategy is essentially demand-driven, not cost-driven: “The primary reason we have facilities and engineers in emerging markets like China, India, Brazil, and the Czech Republic is because that’s where an increasing number of cars are being made and sold,” he says. “Our customers, the automotive manufacturers, demand engineering and technical development support for their growing emerging-market customer base.”
By 2011, he points out, China is expected to be the largest auto market in the world, and India to be the fifth-largest. It’s incumbent on his company to sell these markets while maintaining a globally competitive technology base. “In China and India,” says Farashuddin, “a lot of people who own vehicles, especially the larger vehicles, have chauffeurs, and the owners sit in the back seat. So you have to design audio systems and climate control systems so they can be controlled from the back seat, as well as from the front seat. That’s a piece of insight that you pick up only when you’re in China and India working with local engineers.”
Visteon is organized into four product lines: interiors, climate control, electronics, and lighting. Each group keeps its product development function separate. That makes them easier to manage, but significant challenges remain. Each group struggles to find and retain engineering talent around the world. Although the talent pools outside North America and Europe are growing rapidly, wages are rising along with the talent. Meanwhile, in these other countries, local players are building out their own R&D facilities, so local engineers have more choices about where to work. That’s made it more difficult for companies like Visteon to retain talent — a problem that is exacerbated, Farashuddin believes, by the growing sense of national pride local engineers feel in working for homegrown automotive firms.
As auto sales in emerging markets increase, the auto industry will continue to move R&D to these markets. Our analysis shows that China is already the largest importer of automotive R&D, and its share will keep growing. Tough as the auto business is, however, the goal is no longer simply to cut costs. Farashuddin likes to use the term “automotive intellect” to describe the knowledge gained through the process of designing cars and the components that go into them. Until recently, the flow of automotive intellect has been going from the West to the emerging markets. But, says Farashuddin, “there’s a lot of automotive intellect that’s being generated now in the emerging markets, and you have to be in these markets to stay on top of your game. And five years from now, you’ll see some leading technology being developed first in India or China, and flowing back to the West.”
Computing and Electronics: Bright Ideas
Unlike cars, the same computing and electronics products can be sold in just about any market, with little regard for local needs and tastes. That’s why, unlike the auto industry, the C&E sector is motivated less by demand and more by the search for talent and new ideas. To that end, companies worldwide are spreading their R&D resources across a wide swath of the globe, in both developed and emerging markets.
Overall, 252 C&E companies that made the Global Innovation 1000 this year led those in all other industries in terms of raw dollars invested in R&D; in 2007, the industry spent $142 billion, or 29 percent of the total. That figure is up 8.5 percent from the year before, although R&D spending as a percentage of sales remained the same, at 7 percent, about in line with the sector’s average R&D intensity over the past five years. Among the 50 C&E companies we analyzed closely, the U.S. was, again, the largest “net exporter” of R&D spending, at $16.9 billion, while China was the largest “importer,” taking in $14.3 billion. The U.K. and India imported about $5.5 and $6.8 billion, respectively, while fourth-ranked Israel took in $4.9 billion — indicating that R&D in this sector is spread much more evenly between developed and emerging nations. Indeed, R&D in the C&E sector as a whole is significantly more diversified than it is in the auto sector. Fully 70 percent of the sector’s R&D spending originates in just the U.S. and Japan, yet only 40 percent of spending takes place in those two countries. The rest is spread among more than 20 different countries.
That degree of diversification arose in great part as a result of the industry’s quest for talented scientists and skilled engineers — wherever they can be found. Consider the research footprint of HP Laboratories, the corporate research arm of Hewlett-Packard Company. Despite its longtime connection to Silicon Valley, HP Labs spends just 20 percent of its budget in the U.S.; the rest is spread among facilities in the U.K., Israel, India, Russia, China, and Japan.
Says Prith Banerjee, director of HP Labs and senior vice president for research, “HP Labs is really all about people. Wherever the best researchers are, we need to tap into those brightest minds. And the best researchers happen to be located in regions that have very strong universities that are producing top-quality Ph.D.s.” HP Labs’ commitment to open innovation extends beyond siting research facilities. In May, HP’s open innovation office issued a call for research proposals and received more than 450, from 200 universities in 28 countries; in August, it announced plans to fund 41 of those proposals at 34 universities in 14 countries.
HP has also moved to concentrate its 600 researchers on five “high-impact” areas, including “dynamic cloud services” and “intelligent infrastructure,” and to place bigger bets on fewer projects. That demands a portfolio-based approach to its research efforts, in which projects are divided into three areas — pure research, applied research, and research designed to feed directly into product development. The goal: to boost the transfer of the most promising new technology from the research phase to the development phase.
IBM, the third-largest spender on R&D in the C&E group ($6.2 billion in 2007), has a similarly globalized, if not highly diversified, R&D footprint, with well-established facilities in Japan, Germany, Switzerland, and Israel. The company’s early move into India, for instance, was primarily a cost play, notes Subramanian Iyer, distinguished engineer and chief technologist at IBM’s Semiconductor R&D Center, where he is charged with defining R&D strategy for IBM Microelectronics. Yet that motivation has changed significantly as researchers and engineers there have become more sophisticated.
IBM’s chip design begins in facilities in the U.S., where the chips are designed and the prototypes are tested. As IBM’s Indian employees become more skilled, more and more analysis of the design and testing data is being performed in India, says Iyer. The work gets turned around rapidly — sometimes even overnight — a kind of real-time processing that Iyer cites as one of the many significant advantages of global R&D. The design and testing process is so costly that any time saved is valuable.
Local demand does motivate part of the footprint strategy at both HP and IBM. Banerjee points to HP’s facility in Bangalore, India, whose theme is “innovation for the next billion customers.” “It is difficult,” he points out, “for researchers in Palo Alto or Cupertino to imagine a need for a keyboard for India’s 23 different languages. So we’ve moved much of our work on gesture-based keyboards to India, to work on the best user interface for accommodating all those languages, in part because we believe our researchers there are best suited to work on these problems.”
And at IBM, Iyer cites India, which lacks widespread broadband but boasts a strong mobile phone network that can connect people to the Internet. Unfortunately, the phones themselves lack Internet capabilities, so IBM is working on a technology called VoiceWeb that allows people to surf the Web using voice rather than typing. “We see the tremendous potential for coming up with products that are very, very specific to local conditions,” says Iyer. Indeed, as he points out, IBM’s revenues in India have grown at 25 to 35 percent each year for the past three years.
Health Care: Breaking Down Barriers
Although our analysis of the health-care industry covers primarily the research side of the equation, both sides are seeing significant growth, as companies look to promote open innovation in pure research, while conducting more and more of their clinical testing and development in LCCs all over the world.
Overall, R&D in the health-care sector grew by $11 billion in 2007, bringing the total to $109 billion, second only to computing and electronics. The sector’s sales increased by 9 percent, to $813.6 billion, while R&D spending grew by 12.8 percent; as a result, R&D intensity in the industry grew to 13.4 percent of sales in 2007. That level of intensity is almost 10 percentage points more than the overall average for the Global Innovation 1000; only the software and Internet sector invests at a higher rate.
Despite the sector’s high level of investment, health care’s global research footprint is significantly less diverse than either autos or C&E, and much of the sector’s money continues to be spent in the developed world. The U.S., where 58 percent of the health-care companies we analyzed are based, accounts for 53 percent of the industry’s total spend, or $49.8 billion, and U.S. companies export just 46 percent of that total. Meanwhile, companies based outside the United States import $11 billion into the U.S., bringing net exports from the U.S. to just 23 percent of the total. Compare that to China, which is the only LCC among the top 10 spend locations, with just 3 percent of the total spend in the industry.
When it comes to sending R&D offshore, and especially to LCCs, first-mover status belongs to development, not research. We estimate that about 70 percent of health-care R&D is devoted to development; about two-thirds of the development money is spent on clinical trials, and the rest goes to process development, regulatory filings, and the like. At present, about 15 to 20 percent of the money spent on clinical work is going to countries outside the U.S., Europe, and Japan. Meanwhile, the research side has been much slower; in 2007, close to 95 percent of the money going into drug discovery was spent in the U.S., Europe, and Japan.
Why have companies’ clinical efforts moved faster offshore than pure research? Because they need access to people willing to participate in clinical trials of new drugs, and they need to perform those trials cost- effectively. In addition, access to emerging markets is becoming an important factor for health-care companies choosing where to locate R&D, as these markets become wealthier and their middle classes grow in size. Piracy concerns have also inhibited pure research. Those are waning in significance, however, as countries such as China and India establish stronger mechanisms for protecting intellectual property.
Furthermore, until recently the skills and capabilities to perform basic health-care research didn’t exist outside the West. That, too, is changing as the skills base in other countries improves. Western health-care companies are beginning to establish collaborative efforts with universities and other entities in emerging markets to take advantage of that improvement. Novartis AG, for instance, recently opened a major R&D facility in Singapore to conduct research on tropical diseases, and Merck & Company Inc. has been working with INBio, a nonprofit group dedicated to maintaining biodiversity in Costa Rica, to gain access to promising natural compounds.
Much of this research activity is directed at solving an ongoing problem faced by the entire pharmaceutical industry: Over the past decade or so, the industry has come up with few novel and even fewer blockbuster drugs. The old “Big Pharma” research model, centered on chemistry-based, or small-molecule, drugs, relied on automated processes to find drugs that worked against a known disease target. And the science behind those targeted disease areas was better understood than the science in disease areas that are currently the biggest challenges for society, such as obesity, cancer, and central nervous system disorders.
Concurrently, over the past decade or so, there have been a number of exciting biological discoveries, such as the human genome project, the advancement of peptide-based therapeutics, and stem cell research, that have shed new light on human biology and furthered our understanding of complex diseases. The innovation potential in drug development is enormous, though highly risky. Hence the growing research interest in so-called biologics — large-molecule drugs designed to solve complex medical problems, such as cancer. Says Usama Malik, senior director of corporate strategy and innovation at Pfizer Inc.: “If you look at the top 100 drugs, somewhere between 30 and 35 percent of them are now biologics…in a few years more than 25 percent of the industry’s drug pipeline will be comprised of biologics.”
Thus, the industry is facing major changes. The patents of many blockbuster drugs will expire in the next three years, eroding tens of billions of dollars of top-line revenues. The billions of dollars poured annually into innovation have returned little over the last decade. And future innovation will be driven not by scale or process, but rather by breakthrough science, a better understanding of human biology, and validation of new disease targets. Therefore, the industry’s business models and its models of R&D practice must be updated to fit the new realities.
According to Malik, “The industry will increasingly invest in new models that leverage the entrepreneurship seen in the smaller pure-play biotech firms that have shown higher productivity over the last decade and a half, while taking advantage of the scale and scope of Big Pharma, in development, on the regulatory front, and in the commercial markets.” These new research models bring the smartest researchers, scientists, and academics, both inside and outside the company, together in small groups — usually of fewer than 100 people — and give them the freedom to operate and to develop their culture of innovation and productivity. The ultimate goal is to enable them to develop new and meaningful drugs with better success.
To that end, Pfizer and other companies are rethinking their innovation efforts from top to bottom, splitting their research teams into smaller and more focused groups, and breaking down the barriers between internal and external research. A year ago, Pfizer founded its Biotherapeutics and Bioinnovation Center, a federation of small, cutting-edge biotech companies that maintain their own brand, culture, and operating mechanisms, while fostering strong collaboration within and outside the company. Headed by Pfizer’s Corey Goodman, the center employs a portfolio approach that Pfizer expects to build on around the world, wherever the best talent and the best science can be found.
Ultimately, of course, this shift in focus is designed to improve health — to discover new drugs in a calculated number of promising areas of medical research. In that sense, it is not unlike HP’s plan to make big bets in a few areas of technology research. The effort to globalize this process will certainly bring more new good ideas to an industry that is actively looking for them.
The Future of the Global R&D Footprint
As the evidence from these top innovation spenders shows, when corporations move to globalize their R&D efforts, there is much to gain. The research and engineering talent to be found in emerging markets is growing rapidly in sophistication, training, and skills, a trend that will accelerate as these markets become more developed. Companies seeking new sources of ideas are sure to gain from that growing talent pool. And as those emerging markets evolve and grow, they will become more attractive to companies looking to do business there. That in turn will make it incumbent on them to understand those markets and develop more products locally, if they hope to remain competitive with other global competitors as well as with increasingly sophisticated local players.
Simply globalizing one’s innovation footprint, however, will not guarantee success. Companies must be careful about where to deploy their R&D resources, keeping in mind where the best talent can be found and which markets they want to enter. And there are operational challenges in performing R&D overseas: Too much fragmentation of effort, for instance, can undermine the large investments in infrastructure and technology that a gloal footprint requires, and can cost companies greatly in lost collaboration. The virtues of a global innovation strategy are real, but so is the need to execute that strategy intelligently and to track the benefits.
Given these factors, it is no wonder that cutting costs is fast receding as the primary motive for sending R&D overseas. The rapid pace of globalization over the past several decades has created a complex and highly dynamic business environment; every corporation must bring to its market strategy a multinational perspective. Corporate R&D represents a significant part of that shift. As this year’s Global Innovation 1000 study demonstrates, companies around the world have already invested heavily in aligning their innovation efforts with the global strategies they have adopted to pursue profitable growth.![]()
|
Profiling the 2007 Global Innovation 1000 |
|
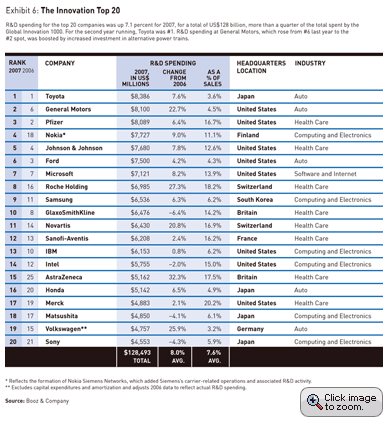
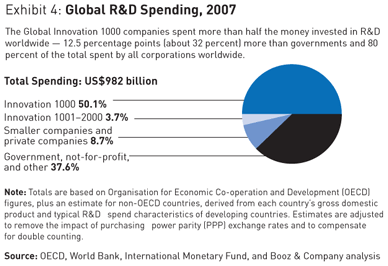
The companies in the Global Innovation 1000 spent a total of US$492 billion on R&D in 2007, a 10 percent increase for the year — and well over the 6.7 percent compound annual growth rate on such spending that our data reveals since 1999. For the second year in a row, the #1 spender on R&D was Toyota Motor Company, with a budget of $8.4 billion, up 7.6 percent from 2006. At the other end of the list, coming in at #1000, Dongbu HiTeck Company, a Korean chemical enterprise, spent $53.4 million on R&D. The vast difference between those two numbers (Dongbu HiTeck’s R&D spending is less than 1 percent of Toyota’s) suggests why the top 20 companies account for more than a quarter of the total spent by the Global Innovation 1000, and the top 100 companies account for 63 percent of the total. The total 2007 R&D spending of the Global Innovation 1000 represents 80 percent of all corporate R&D spending of $613 billion, we estimate, and 50 percent of total worldwide R&D spending, including that of governments, which was $982 billion. (See Exhibit 4.)
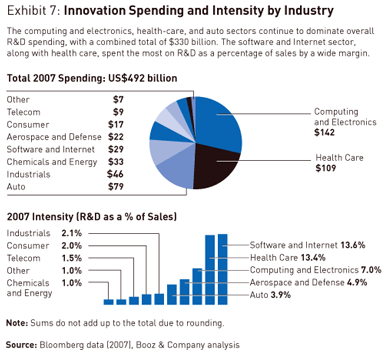
Of the top 20 R&D spenders, the Nokia Corporation upped its spending by 9 percent, thanks to its joint venture with Siemens AG’s mobile phone division, thus dropping Siemens’s R&D spend to #21. The only other company to fall off the top 20 list was DaimlerChrysler, after the sale of the Chrysler division. That allowed AstraZeneca and the Sony Corporation to rejoin the list. (See Exhibit 6.) For the third year in a row, three industries — computing and electronics, health care, and auto — led R&D spending among the Global Innovation 1000, representing two-thirds of the total. Computing and electronics continued to lead, increasing spending 8.5 percent over last year, to $142 billion, for a 29 percent share of the total, even though R&D spending as a percentage of total sales remained steady, at 7 percent. Health care boasts the second-largest share, at 22 percent, though its R&D intensity is significantly higher, at 13.4 percent of sales. Auto holds the number three position, with 16 percent of the total; R&D spending rose 8 percent in 2007, well above the industry’s 3.7 percent five-year compound annual growth rate. Still, the sector with the greatest proportion of R&D spending to sales continues to be software and Internet, at 13.6 percent, driven in part by a 15.6 percent increase in R&D spending, the largest of any industry. (See Exhibit 7.)
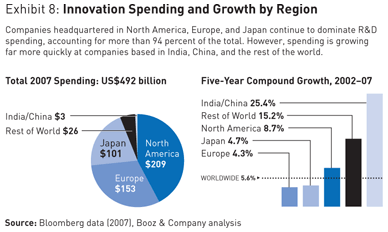
As noted in the article, companies headquartered in the three major regions — North America, Europe, and Japan — accounted for 94 percent of the total R&D spending of the Global Innovation 1000, down 1 percent from last year. That’s in part because countries headquartered in Europe boosted spending by 12 percent (versus the global average of 10 percent), increasing their share of global R&D spending to 31 percent. Although companies headquartered in China and India remain tiny by comparison, contributing just 1 percent of the Global Innovation 1000’s total spending, they increased their R&D spending by more than 22 percent in 2007, far outpacing the worldwide five-year compound annual growth rate of 5.6 percent. (See Exhibit 8.)
The point of these trends is clear: whether looked at as a whole, by region, or by industry, the Global Innovation 1000 companies are continuing to demonstrate their belief in the importance of innovation to their overall strategies. Their challenge, as always, will be to make sure all those billions of dollars are spent effectively. — B.J. and K.D. |
|
Booz & Company Global Innovation 1000: Methodology |
|
Booz & Company identified the 1,000 public companies around the world that spent the most on research and development in 2007. To be included, companies had to make data on their R&D spending public; all data is based on the last full-year data reported by June 30, 2008. Subsidiaries that were more than 50 percent owned by a single corporate parent were excluded because their financial results were included in the parent company’s reporting. This is the same core approach to identifying the Global Innovation 1000 that we have used in the previous three years of the study. For each of the top 1,000 companies, we obtained key financial metrics for 2001 through 2007: sales, gross profit, operating profit, net profit, R&D expenditures, and market capitalization. All foreign currency sales and R&D expenditure figures prior to 2007 were translated into U.S. dollars according to the average exchange rate for the year. In addition, total shareholder return was gathered and adjusted for each company’s corresponding local market total shareholder return. Each company was coded into one of nine industry sectors (or “other”) according to Bloomberg’s industry designations, and into one of five regional designations as determined by each company’s reported headquarters location. To enable meaningful comparisons across industries, we indexed the R&D spending levels and financial performance metrics of each company against its industry group’s median values. To understand the global distribution of R&D spend, the drivers of that distribution, and how the distribution affects the performance of individual companies, we researched the global R&D footprint of the top 100 companies in terms of R&D spend, plus the top 50 companies in the three largest industries in terms of R&D spend (auto, health care, and computing and electronics). A total of 184 companies — reflecting overlaps in the top 100 and the three selected industry lists — were evaluated in detail. This subset of the Global Innovation 1000 was responsible for US$351 billion of 2007 global R&D spending, representing 71 percent of the spending done by all companies in the study and 57 percent of all global private-sector R&D activity. The distribution of R&D spending across countries was assessed for these 184 companies. When geographic breakdowns were not publicly available, we collected data on the location of R&D facilities, the product segments each supports, the year each facility was established, and the number of employees by facility, sales by product segment, and global distribution of sales. This data was used to allocate total R&D dollars to the countries where facilities were located. Supplemental interviews were conducted with a subset of respondents among innovation leaders in the selected industries. The detailed research on these 184 companies covered activities at 3,407 R&D sites spanning 47 countries. |
Reprint No. 08405
Author profiles:
Barry Jaruzelski is a partner with Booz & Company in Florham Park, N.J., who leads the firm’s work for high-technology and industrial clients. He has spent more than 21 years working with clients, specializing in corporate and product strategy, product development efficiency and effectiveness, and the transformation of core innovation processes.
Kevin Dehoff, a partner with Booz & Company in Florham Park, N.J., is the global leader of the firm’s innovation business. He has spent more than 16 years helping clients drive growth and improve performance through innovation, including research and development, technology management, product planning, and new product development.
Also contributing to this article were Booz & Company Associate Kunal Vaed, Senior Consultant Aditya Ramamurthy, and s+b Contributing Editor Edward H. Baker.


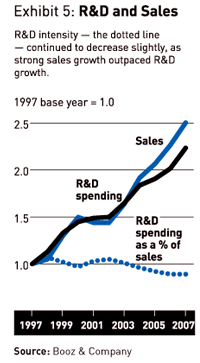 Revenues for the Global Innovation 1000 companies were $13.2 trillion in 2007, an impressive increase of almost 12 percent over last year’s total. But, because sales grew two percentage points faster than R&D spending, the “intensity” of spending — R&D spending as a percentage of sales — decreased this year, to 3.7 percent from 3.8 percent in 2006, continuing a 10-year downward trend. (See Exhibit 5.)