The Customer Connection: The Global Innovation 1000
Booz Allen Hamilton’s annual study of the world’s largest corporate R&D spenders finds two primary success factors: aligning the innovation model to corporate strategy and listening to customers every step of the way.
How do companies innovate successfully? They can spend the most money, hire the best engineers, develop the best technology, and conduct the best market research. But unless their research and development efforts are driven by a thorough understanding of what their customers want, their performance may well fall short — at least compared to that of their more customer-driven competitors. John Schiech, president of the DeWalt division of Black & Decker (the division that makes power tools used by professional contractors), put it simply. When asked what made his company so successful, he responded, “It’s engineers and marketing product managers spending hours and hours on job sites talking to the guys who are trying to make their living with these tools.”
This insight represents a further amplification of our ongoing research into the costs and value of corporate innovation. In 2006, as in the two previous years of our annual study of the Booz Allen Hamilton Global Innovation 1000 — the 1,000 publicly held companies around the world that spent the most on research and development — overall corporate revenues among these companies increased 10 percent. Once again, their overall spending on research and development also rose, to US$447 billion this year. And as in years past, we found no statistically significant connection between the amount of money a company spent on innovation and its financial performance.
We also compiled a list of high-leverage innovators, as we did last year. These were the companies that, compared to other companies in 2006, got a significantly bigger performance bang for their R&D buck. The high-leverage innovators consistently achieve better sustained financial performance than their industry peers while spending less on R&D. We’ve spoken to executives at a number of these companies, including Black & Decker. When listing the reasons for their success, they all mention two key factors. The first is strategic alignment: They work hard to align their innovation strategies closely to overall corporate strategy. The second is customer focus: They all have processes in place to pay close attention to their customers in every phase of the innovation value chain, from idea generation to product development to marketing.
This year, for the first time, we looked more directly into the connections between corporate and innovation strategy, and between innovation strategy and in-depth customer understanding. We selected a group of the Global Innovation 1000 companies, representative of the total in their mix of industries and company sizes, that spent a combined total of $68 billion on R&D in 2006. Through surveys and follow-up interviews with C-suite and senior executives of companies such as IBM, Thales, GE, Bayer, 3M, Autoliv, and Denso, among others, we explored their approaches to technology, customers, and markets, and how tightly their innovation strategies were connected to their overall corporate goals and direction.
The results were revealing. From our statistical analysis of the responses (see Methodology), we identified three distinct innovation strategies. Because nearly all the companies favored just one of the three strategies, we classified them into three categories.
Need Seekers: These companies actively engage current and potential customers to shape new products, services, and processes; they strive to be first to market with those products.
Market Readers: These companies watch their markets carefully, but they maintain a more cautious approach, focusing largely on creating value through incremental change.
Technology Drivers: These companies follow the direction suggested by their technological capabilities, leveraging their investment in research and development to drive breakthrough innovation and incremental change, often seeking to solve the unarticulated needs of their customers.
Perhaps the most important finding that emerged from the study was that no one of these strategies performed consistently better than any other — indeed, high-leverage innovators can be found in each of the strategy categories. The most significant performance differences correlated not with their innovation strategies but with those critical factors mentioned above: strategic alignment and customer focus. Over the past three years, companies that say their innovation strategies are tightly aligned with overall corporate objectives boasted 40 percent higher growth in operating income and 100 percent higher total shareholder returns than those whose innovation strategies are less aligned. Companies more focused on customer insight or market needs are also more successful than their less-customer-focused peers. In particular, companies that directly engaged their customer base had twice the return on assets and triple the growth in operating income of the other survey respondents.
The Numbers
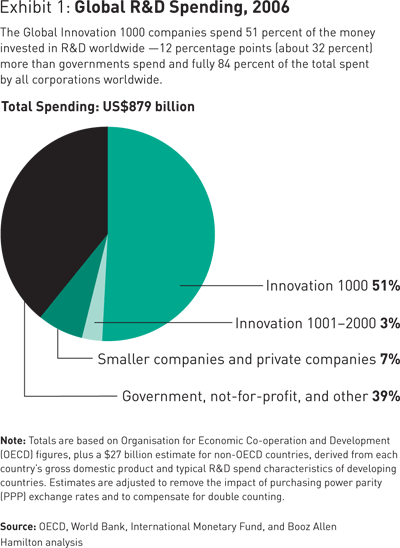
Overall, this year’s Global Innovation 1000 continued a trend of R&D spending increases that goes back to at least 1999. At $447 billion, the total amount spent on innovation by this group in 2006 was more than double the 2006 gross domestic product of the Republic of Ireland, and it represents fully 84 percent of worldwide corporate R&D spending (which is estimated to be $540 billion; see Exhibit 1). Total spending by these companies was 10 percent greater than the 2005 total of $407 billion, which is a growth rate double that of the previous five years. In dollar terms, that increase is significant: Had the growth in R&D spending maintained its five-year average rate, that total would have been $20 billion less than its actual amount today.
Meanwhile, the overall sales total of the Global Innovation 1000 — $11.8 trillion — grew just as fast, at 10 percent, a rate that tracks with the five-year average. That puts the 2006 ratio of R&D spending to sales, a measure of the intensity of a company’s innovation efforts, at 3.8 percent, meaning that corporate R&D spending as a percentage of sales leveled off last year, ending a four-year decrease. (In 2001, it was 4.4 percent.) These findings run counter to the view that corporate innovation investment is declining. In fact, the overall growth in spending also makes it that much more critical for individual companies to be sure they’re getting the most out of their innovation dollars.
This year, nine of our 10 industry sectors accelerated their R&D spending — only the automotive industry spend grew at a slower rate over the last year than its five-year historic growth rate. More intriguing were the changes in the geographic distribution of R&D spending. Companies headquartered in North America increased their absolute R&D spending by 13 percent, accounting for most of the growth among the Global Innovation 1000. China and India continued to lag in intensity, with a spending level of only 0.8 percent of sales, reflecting the lower level of maturity in these markets and perhaps lower costs. But China and India may be racing to catch up; they continue to lead all geographic regions in the rate of growth in absolute R&D dollars spent, at more than 25 percent.
It’s still unclear whether this year’s growth in R&D spending represents a temporary high point or a long-standing trend. It clearly reflects the increased value that companies in every industry and every region around the world place on innovation. This shift may, in part, be a tribute to the growing belief that innovation is an engine for corporate growth, in a more and more competitive environment. Or it may simply reflect record corporate profits, which have allowed companies to put more resources into their R&D efforts. But more spending doesn’t necessarily lead to smarter spending.
The Strategic Imperative
As noted, our statistical analysis of innovation strategies divided the companies we studied into three distinct strategy categories: Need Seekers, Market Readers, and Technology Drivers. (See Exhibit 6.)
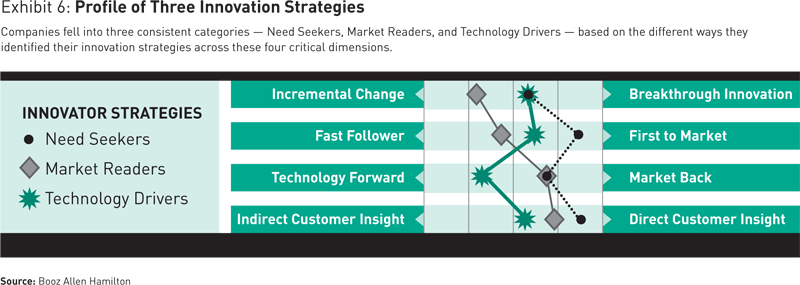
Companies in the Need Seekers category identified their innovation priorities as being first to market and basing R&D efforts on getting direct, proactive input from customers. Market Readers particularly distinguished themselves through their preferences for incremental change and being fast followers into markets. And Technology Drivers said they took a technology-forward approach to innovation while remaining less concerned with direct customer input into the process.
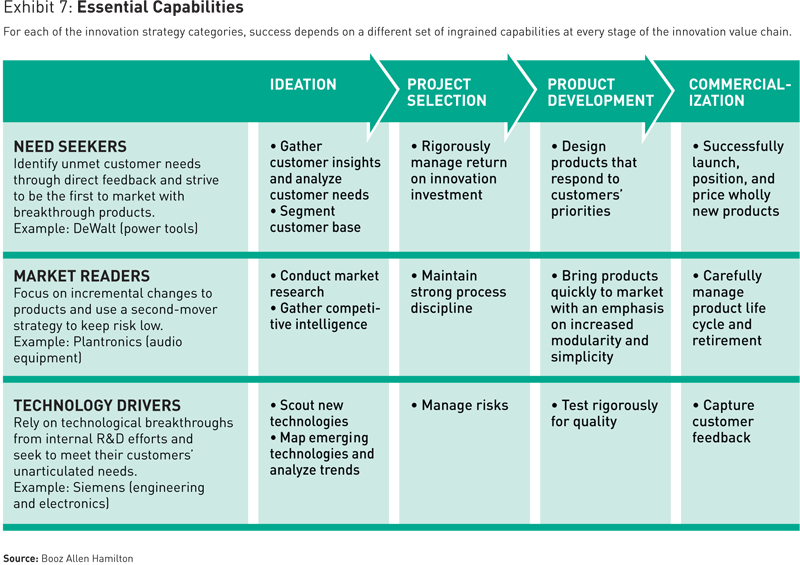
The companies favoring each strategy identified a different set of critical competencies and key processes for success (see Exhibit 7), but the highest performers in all three groups, as noted, all identified strategic alignment and customer focus as priorities. We also found several significant performance differences among the three categories. R&D spending among the Need Seekers was 40 percent greater than that among Market Readers, which can be explained by the Need Seekers’ strong drive to be first to market. And their average gross margins were 20 percent greater than the margins of Market Readers, whereas Market Readers’ operating margins were slightly higher. This suggests that being first to market may enable a company to price its products or services at a premium, but that, on average, the operating costs and risks associated with this strategy will remove some of those profit gains.
Even so, the stock markets appear to reward companies that strive to be first to market; average shareholder returns and market cap growth were more than 40 percent higher for Need Seekers. And although each group showed a similar mean value for return on assets, the standard deviation for Technology Drivers was 40 percent higher; this indicator of variability suggests that Technology Drivers pursue a riskier innovation strategy than the two other categories.
Each category has its performance pros and cons; none of them has any inherent overall performance advantages over any other. What matters most is choosing an innovation strategy that matches the corporate strategy, aligning those approaches tightly, and then executing the innovation strategy successfully.
Given these distinctions, we looked more closely at four innovative companies, choosing at least one for each category. In in-depth interviews with senior R&D executives at these four companies, we asked how they designed and implemented their innovation strategies — especially in response to their overall corporate strategies, their market conditions, and the nature of their customers.
Need Seekers
John Schiech, president of Black & Decker’s DeWalt division, has a valuable story to tell about the importance of paying close attention to your customers. “The best-selling miter saws on the market in the early 1990s cost about $199, and they all had 10-inch blades. Our guys went out and did some research, and found a lot of people building big colonial-style homes with big moldings. The saw blades cut only halfway through those big pieces of trim. So they had to pass a 16-foot piece of molding out the window, flip it around, pass it back in, and make the rest of the cut. We realized that if we moved to a 12-inch blade, which required a completely different, much bigger saw, they could make these cuts in one pass. So we developed and launched the 12-inch miter saw, and charged $399. It became the number one–selling miter saw by a huge margin, and remains so to this day.”
DeWalt’s approach to innovation puts the company squarely in the Need Seekers category: generating ideas directly through close contact with customers, then using those insights to develop and test breakthrough products and get them into the market before competitors can. Thanks in part to the performance contributions of its DeWalt division, B&D was a high-leverage innovator in both 2005 and 2006 (the two years we have tracked “bang for the buck” in innovation), and the parent company employs many of the same innovation practices DeWalt uses, in an even more rapidly changing do-it-yourself market.
B&D started branding its professional power tools with the DeWalt name in 1991, reserving the name Black & Decker for its line of consumer tools and small appliances (such as toaster ovens and coffeemakers). That put DeWalt squarely in an extremely competitive market, with extremely demanding customers. Says Schiech, “In the commercial arena, the user really only cares about the product itself. He’s always going to buy the best tools to do his job regardless of what brand it is. If you can produce the best product, the one that makes that contractor the most efficient, the most productive, and the most reliable, then you will win the business.”
DeWalt’s engineers and marketing product managers incorporate copious customer input at the front and back ends of the innovation process. They spend a great deal of time at job sites talking to people who make their living with power tools, observing how they work, gathering information, and ultimately putting it into databases of tool features and customer contacts that engineers can draw on to help design new products. Then, once prototypes of new products have been completed, those same engineers and marketers take them directly to the same job sites, leave the tools, and come back a week or so later to collect information on how they performed.
Some of the insights from this process have run counter to conventional wisdom. For example, DeWalt customers are willing to pay more for innovative tools, belying the reputation that contractors have as slow adopters of new products. And although some of the efforts DeWalt pursues involve incremental innovations, the company prefers true breakthrough products, in part because it understands that its customers will always be able to tell the difference. “If all you do is a ‘paint-and-label’ [upgrade], you’re not going to get much in incremental sales,” says Schiech. “It’s only when you come with a breakthrough product that you can really change the game in terms of market share.” At the same time, however, the most popular professional power tools have very long product life cycles — as long as 10 or 15 years, says Schiech. “If word gets around that a certain saw is the one to buy, the last thing customers want you to do is change it, because they rely on it to make their living.” So it’s critical that new products work even better, or last even longer, than the products being replaced. DeWalt thus returns regularly to its customers around the world, to make sure that those who swore by an old product will like its replacement even more.
DeWalt typically has 40 or 50 development projects under way at any one time; the company uses a “stage gate” process (involving synchronized milestones, deliverables, and approvals) to coordinate them efficiently. And although fast prototyping and fast tooling have sped up the process, developers are not allowed to skip steps that improve product reliability and durability, especially if moving faster means having less contact with customers. “You can often talk yourself into a short development schedule,” says Schiech, “only to have problems at the back end, which often take longer to solve than the original schedule would have taken.”
DeWalt also scrupulously analyzes the success of its product development efforts. “We spend a lot of time measuring our ability to hit our development schedules on time, on cost, and on quality,” says Schiech. “And we pay close attention to product vitality, which we define as the percentage of our sales that come from products launched in the prior three years. We’re generally above 30 percent, and sometimes inch up to 40 percent and even 50 percent.”
And the company’s overall results? In 1991, with market share numbers in the low teens, says Schiech, DeWalt was selling about $150 million worth of power tools in the U.S. Since then, sales have grown to more than $2 billion annually, representing a market share of more than 50 percent of the U.S. professional power tool market. Those numbers are a tribute not only to the efficiency of DeWalt’s product development process, but also to just how closely the company understands and works with its customer base.
Market Readers
Companies that fall into the second strategy category, Market Readers, demonstrate an overall sense of caution when approaching the innovation process. They spend less on R&D as a percentage of sales, on average, than Need Seekers do. Market Readers tend to prefer incremental product innovation to the breakthrough product that transforms the market. And as a result, they are apt to bring those incremental product innovations into the market as the second mover, preferring a low-risk approach to product introduction.
The Market Reader strategy is just as customer focused as the Need Seeker approach, and it can be just as successful. We interviewed two Market Reader companies: Parker Hannifin, an industrial components manufacturer, and Plantronics, a maker of headsets and other audio equipment. Both companies qualified as high-leverage innovators in both 2005 and 2006. Their success suggests that Market Readers can foster high levels of growth and performance by integrating the R&D process closely with corporate strategy and customer awareness.
For example, when Parker Hannifin CEO Donald Washkewicz rolled out his “Win” campaign in 2001, he defined a new overall strategy, on a single sheet of paper, for this highly diversified, Cleveland-based company. “Among his top goals was profitable growth,” says Craig Maxwell, vice president of technology and innovation, “and one of the elements of profitable growth is innovative products. I live underneath the banner of profitable growth.”
Soon after he joined the company in 2002, Maxwell realized that some divisions were much better at innovation than others. After looking closely at the differences, he instituted a highly disciplined “stage gate” innovation process throughout every division in the company. “We treat every one of [our] 118 general managers and their staff as venture capitalists who are being asked to invest the company’s money in certain projects. And we developed some very, very rigorous value screens in the process to filter out the good projects from the bad.”
The new process deliberately incorporated the role of the market at every step. When generating new ideas, company engineers show drawings and prototypes to customers; when refining the concept engineers go to the customers’ customers, to see how it works in practice. Among the requirements for getting investment approval is thorough feedback from customers affirming the value of the product under development. “We require an alpha customer, or a lead user, to be on the development team,” says Maxwell. “We consider those people to be the canaries in the coal mine, in part because they have a predisposition for sniffing out value. And if it’s not there, they’ll tell you right away that you’re going off in the wrong direction.”
A similarly conservative, value-oriented approach to innovation can be seen in Plantronics, a less diversified and much smaller company, with $800 million in sales for the year ended March 2007. Plantronics spends 9 percent of sales on R&D, while performing well above its industry average — thanks in part to its insistence that its innovation strategy adheres closely to its corporate strategy. Like Parker Hannifin’s, that overall strategy is put explicitly in financial terms; Barry Margerum, vice president of strategy and business development, defines it as “sustainable long-term earnings-per-share growth.”
Plantronics’ core business, headsets, is divided between the commercial market — headsets for operators, workers in call centers, and the like — and the consumer market. The challenge for the company, says Margerum, is orchestrating the different development “cadences” for these two markets. Consumer tastes change more rapidly than do B2B requirements, and the technology on both sides is changing much more rapidly than it used to, given the rise of such technologies as Bluetooth, Wi-Fi, and voice over IP. That makes it incumbent on Plantronics to stay as close as possible to both markets.
“We are data rich in customer insights, whether it be about the mobile professional or the office worker,” says Margerum. “We do demographic research to determine which customers we want to focus on. Then we perform various types of market research to understand what those customers want. This process provides the insights we need to develop the right products.”
On the business-to-business side, that means creating strategic partnerships with corporate customers to determine their specific needs. It also means sharing research into end-user challenges and the ways that new technology might help them achieve business goals. For consumer products, says Margerum, “we’re more on our own. We certainly talk to our channel partners, and sometimes they’re helpful in terms of ideas. But we also have to go out and do our own market research, usually in the form of focus groups and other types of customer shadowing.”
In deciding whether to approve a new product, Plantronics applies a particularly rigorous program of measurement. In addition to such metrics as revenue from new products, the company has begun to track market response against early sales forecasts. Says Margerum: “There are a number of strategic filters — potential return on investment, sales forecasts — we’re going to use to grade each of our products under development, and that will help us line up in a rationalized way what products we should bring to market.” It’s a complicated process, but in Margerum’s view, it’s a critical component of successful innovation. “The more metrics you have, the more able you are to assess performance, and the better you can become.”
Can companies stifle innovation by paying too much attention to the market and trying to measure everything? Not according to either Maxwell or Margerum. Maxwell succinctly sums up the innovation philosophy of all the Market Readers: “I don’t have a problem with [our] people searching for new technology, but I want them to be able to understand and articulate the value in the eyes of the customer. If they can’t do that, we make it no secret that we won’t support it and we won’t tolerate it.”
Technology Drivers
Technology Drivers, in generating product ideas, lean toward deploying their own technological skill and relying on unarticulated customer needs for product inspiration, rather than following the market and focusing on direct customer input. This stance has served many of these companies well, particularly those that temper their own design creativity with a rigorous, strategically oriented view of potential customer needs.
Siemens AG, the German engineering and electronics leader with $111 billion in 2006 sales, exemplifies the future-needs-focused approach to innovation developed by successful Technology Driver companies. Like Parker Hannifin, Siemens is a highly diversified, global company. Its business lines include health care, electronics, and power generation. Each of the business units has its own innovation and product development team, and regular internal studies have demonstrated that the company’s highest-performing businesses are also the ones with leading technical positions in their markets.
Meanwhile, Siemens Corporate Technology sits on top of the structure, absorbing about 5 percent of the company’s total R&D budget and helping to guide long-term, cross-disciplinary research and planning. “We have very clear relationships with our business units,” says Paul Camuti, president and CEO of Siemens Corporate Research, the U.S. arm of Siemens Corporate Technology, “and the measurement discipline in place, so that we know that the work we’re doing is relevant to them. While they look out into their markets and derive needs from their customers, we’re looking out there as well, but with a sharp eye on technologies that will impact the future.”
To that end, at the corporate level, Siemens has begun to align its innovation portfolio with such long-term trends as the rise of personalized health care. The company, which has historically been a leader in medical devices (developing the first implantable pacemaker in the 1950s), recently began expanding its innovation portfolio in diagnostic technologies. Says Camuti, “That decision is a good example of how we work hand-in-hand with the business units, and across several units at a time. Our medical business has deep expertise in the needs and the drivers of the health-care industry. And thanks in part to work we’ve done in large, dynamic power systems, we have a deep understanding of some of the enabling technologies, such as grid computing and large integrated data systems, that can be applied to the health-care domain.”
Making such decisions at Siemens involves a twofold planning process. Shorter-term technology road-mapping efforts are carried out primarily in the business units and typically lead to incremental innovations. Meanwhile, Camuti’s group helps develop broader scenarios at the corporate level. Called “pictures of the future,” these scenarios explore technological trends and other driving forces, such as urbanization, demographic change, and the growing demand for security, mobility, and environmental protection. Then the two levels are joined together through a process Camuti calls “retrapolation” — a play on the word extrapolation. “We work back from those future-use case scenarios to highlight technologies, business models, and processes that could be developed that would shape what those future scenarios look like,” he says. “And then we link that into the road maps.”
This process then feeds into Siemens’s vast network of innovation partners, its strategic venture capital efforts, its active mergers and acquisition program, and its Berkeley, Calif.–based Technology-To-Business Center, which Camuti calls “a full-service external technology screening, incubation, and tech transfer/startup operation.” In Camuti’s view, the company maintains its technological edge by balancing customers’ expressed wants with the company’s insights about their future needs, particularly at the business unit level. “Our power-generation business, for instance, uses formal processes to stay in constant contact with customers. That’s why we have successively invested in next-generation gas turbine technology: It improves efficiencies, reduces operating costs, and improves environmental compliance. If you ask those same power-generation customers about solid oxide fuel cells, which are twice the cost of what they’re using today, they’re not demanding that now. So should we stop all research on fuel cells?” The answer, obviously, is no. “What has changed dramatically,” Camuti says, “is the speed of technological change and thus the level at which you listen to the customer. You’ve got to be somewhat skeptical of what they see as the technical solution, and instead depend on your own core set of people who can creatively link new technology to the future market.”
Tactical Consequences
Is there a best innovation strategy? No. All three of the strategies outlined above can succeed in the marketplace. Is there a best innovation strategy for any given company? Yes. It is the approach that best suits — and is most closely aligned with — the company’s overall corporate strategy and the competitive environment in which the company operates. For instance, the success of Market Readers like Parker Hannifin and Plantronics can be firmly tied to their ability to apply their strongly value-oriented corporate strategy (as defined by clear financial goals) to their R&D decisions.
For DeWalt, technology innovation stems from close observation of its demanding, knowledgeable customers, and breakthrough innovation is more a matter of putting technology to use in new ways than making major new discoveries. Siemens, on the other hand, operates in many different industries, most of them on the cutting edge of technology. Success therefore requires a mix of incremental and breakthrough innovation, with the emphasis on creating new technologies to open up new markets.
The one R&D tactic employed by every company we spoke to was an insistence on managing the innovation process from start to finish as tightly as possible. That included, in every case, a disciplined stage-by-stage approval process combined with regular measurement of every critical factor, from time and money spent in product development to the success of new products in the market. This, combined with a strong portfolio management program, has allowed these companies to understand better how their innovation engines promote their company’s long-term growth.
In the end, the key to innovation success has nothing to do with how much money you spend. It is directly related to the effort expended to align innovation with strategy and your customers, and to manage the entire process with discipline and transparency.![]()
|
Profiling the 2006 Global Innovation 1000 |
|
The industry-by-industry breakdown remained relatively steady this year. Computing and electronics, health care, and auto companies made up more than two-thirds of the total absolute R&D spend, whereas the software and Internet sector and the health-care sector remained the top spenders in terms of R&D intensity — their R&D-to-sales ratios both came in this year at 13.3 percent. The lowest-intensity industries were telecom, at 1.4 percent R&D to sales, and chemicals and energy, at just 1.0 percent. (See Exhibit 3.)
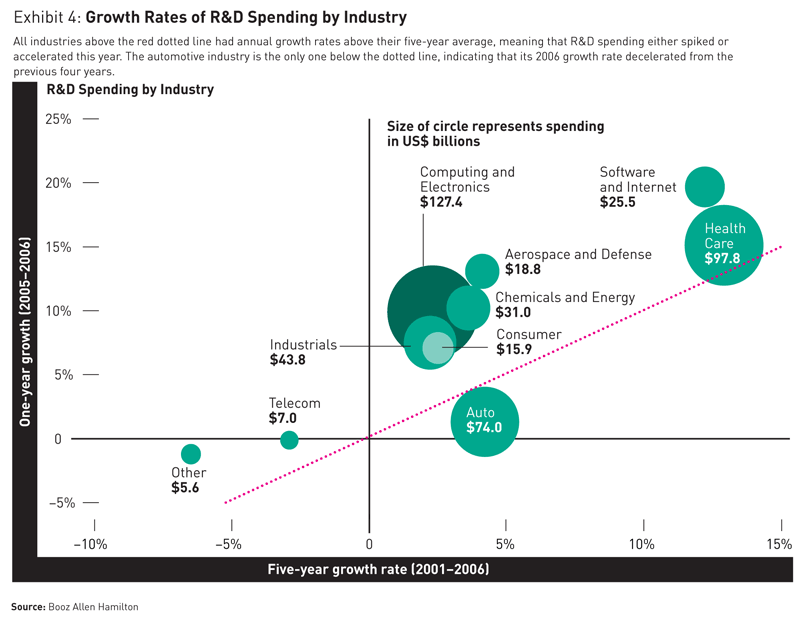
The changes in the rate of growth in absolute spending among the industries tell a rather different story. Exhibit 4 plots each industry in terms of both its year-over-year and its five-year average growth rate; the size of the bubbles represents their total spend. The health-care sector led with a five-year average growth rate of 13 percent, followed closely by software and Internet companies. Growth in R&D spending for the computing and electronics industry was four times its five-year average, and industrials and aerospace and defense grew at more than three times the five-year average. The only industry to fall below its five-year average growth rate was the auto sector, growing at just 1.3 percent this year, compared with its five-year average of 4.2 percent.
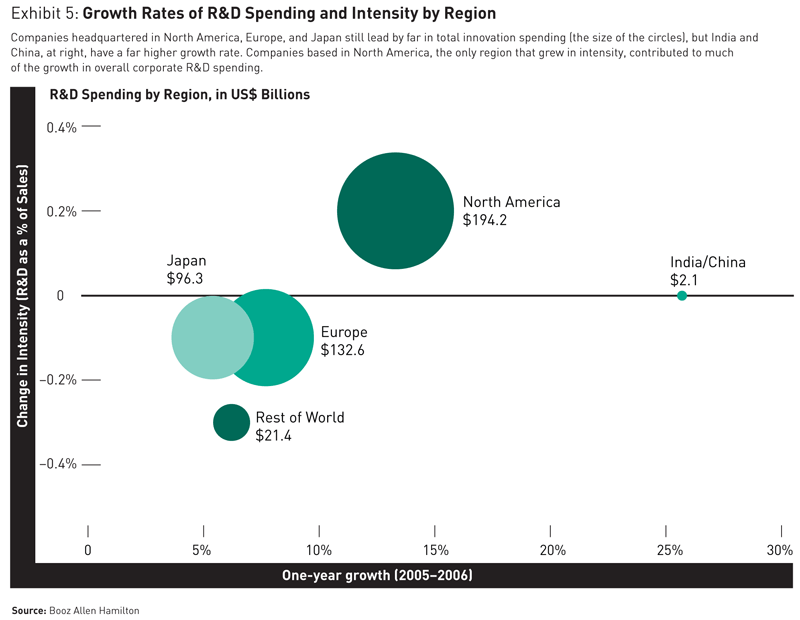
Turning to the geographic breakdown of the Global Innovation 1000, companies headquartered in North America, Europe, and Japan continued to account for the vast majority of the group’s total R&D spend — 95 percent this year, the same as in 2005. Much of this year’s growth in spending came from North America–based corporations in particular, which increased spending 13 percent, nearly double the five-year average. That level of growth kept North America–based companies at the top of the list in terms of R&D as a percentage of sales, with an average of 4.8 percent, followed by Japanese companies at 3.7 percent and European companies at 3.4 percent. China, India, and the rest of the developing world represent a tiny portion of overall corporate spending on R&D — just 5 percent in 2006. But their five-year average growth rates suggest their desire to catch up quickly. China and India grew their 2006 spend by 25.7 percent over the previous year, in keeping with their five-year average rate of growth of 25 percent, whereas the rest of the developing world increased spending by only 0.6 percent, representing a deceleration from their five-year average growth rate of 18 percent. (See Exhibit 5.)
For those who worry about the long-term competitiveness of U.S. corporations, this portrait of the top 1,000 corporate spenders on R&D may seem like encouraging news. China, India, and the rest of the world are increasing their innovation spending rapidly, but they are starting from a tiny base. Looked at another way, companies headquartered in the developing world, including China and India, increased absolute spending in 2006 by $400 million, whereas North America–based companies increased theirs by $21 billion, more than 50 times as much. At that rate, North America will keep its lead in innovation spending for the foreseeable future — the challenge will be to ensure the effectiveness of that investment. |
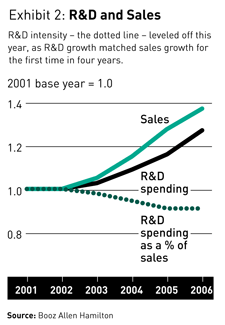 Research and development spending among the companies studied this year ranges from the nearly $8 billion spent by the Toyota Motor Corporation (#1) to the $47 million spent by Meidensha Corporation (#1,000), a Japanese manufacturer of electronics and power generation equipment. Fully 70 percent of these companies increased their absolute R&D spend in 2006, leading to a 10 percent overall growth rate in R&D spending. The overall ratio of R&D spend to sales leveled off at 3.8 percent, and stopped the trend to lower R&D-to-sales ratios for the first time in four years. (See Exhibit 2.)
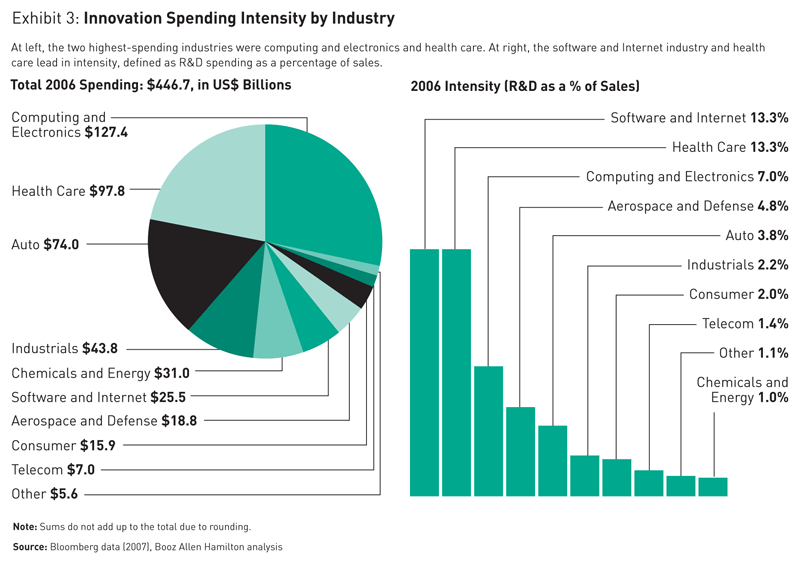
|
The Innovation Top 20 |
|
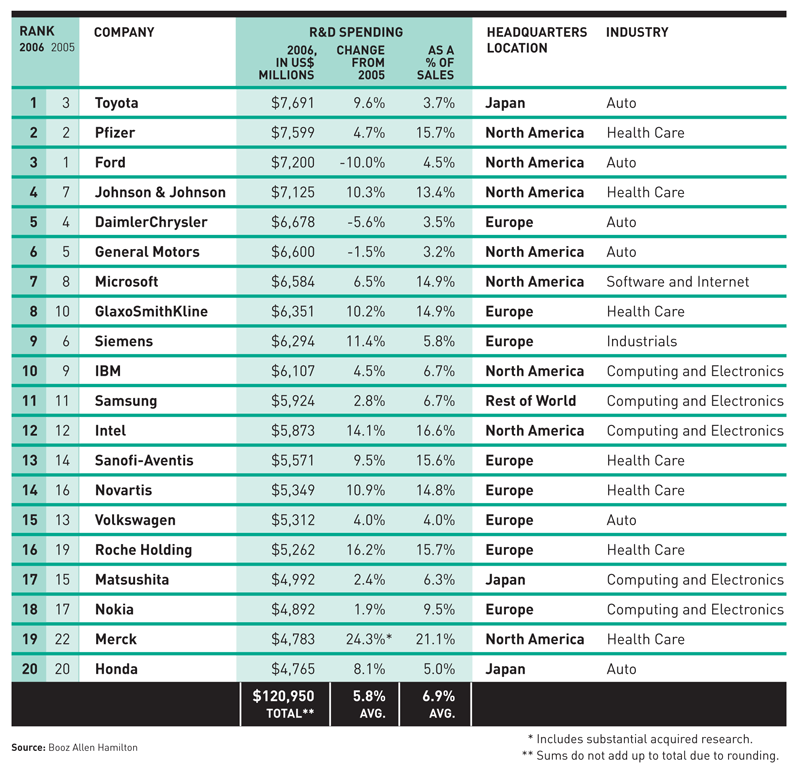
This year’s list of the Top 20 spenders on R&D showed little change from last year. The only company new to the list is Merck, which increased R&D spending by more than 24 percent in 2006, while Sony fell out of the top 20 (to number 21). The Top 20 companies spent a total of $121 billion on R&D in 2006, up from $114 billion. That increase of 5.8 percent is the same as the increase of 5.8 percent in 2005, and is lower than the companies’ five-year average growth of 6.1 percent. The relatively slow spending growth in this year’s Top 20 can be attributed in large part to companies in the automotive sector: The average spend among the group declined 0.2 percent this year. Meanwhile, R&D spending among health-care companies — which includes Pfizer, Johnson & Johnson, GlaxoSmithKline, Sanofi-Aventis, Novartis, Roche, and Merck — grew an average of 11.3 percent. Despite the slowdown in R&D spending growth among this year’s Top 20, the group’s R&D spending- to-sales ratio held steady, at an average of 6.9 percent. That’s still more than double the average R&D-to-sales ratio of 3.2 percent for the other 980 companies in the Global Innovation 1000 this year.
|
|
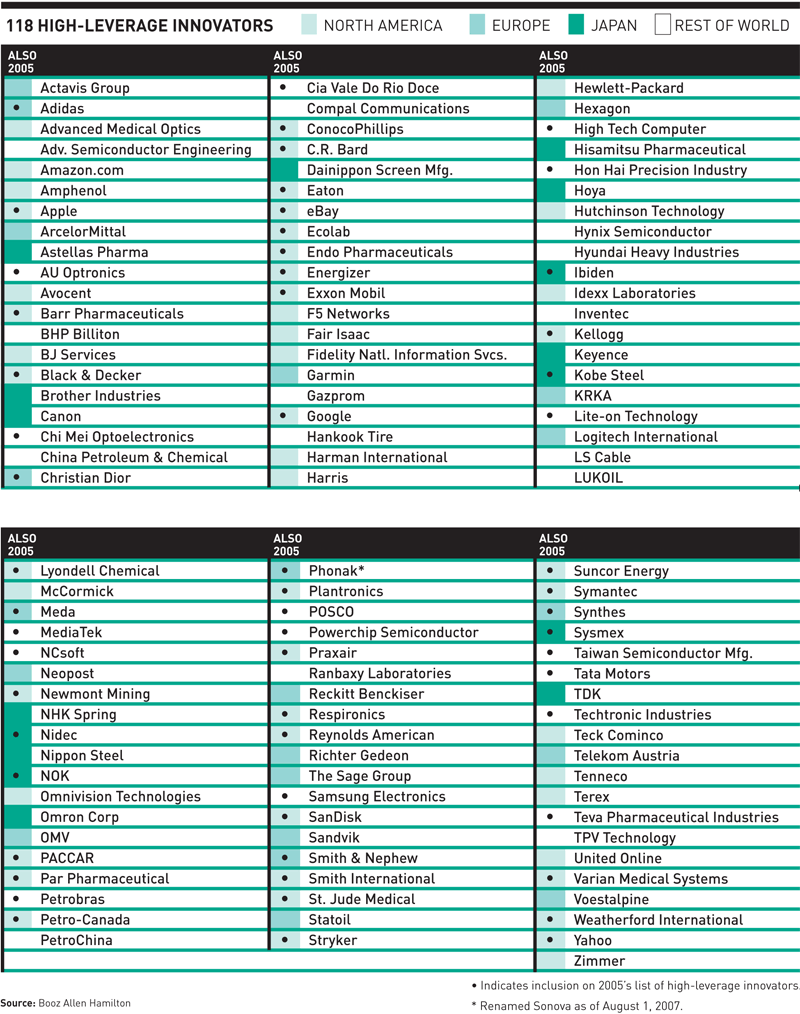
In this year’s Global Innovation 1000, we identified 118 high-leverage innovators, who consistently reap the greatest financial reward for every dollar they spend on R&D. Over the previous five years, these companies had consistently outperformed their industry peers on a basket of performance indicators (sales growth, gross profit growth, gross profit, operating profit growth, operating profit, market cap growth, and total shareholder return) while maintaining a lower R&D-to-sales ratio than their industry medians. This year’s list includes 60 new members and 58 of the 94 companies on last year’s roster. The companies on this list are by no means the only high-performing companies in the Global Innovation 1000 — great performers can be found among companies that spend lots of money — but they are the most consistently efficient innovators. One company that dropped off the list this year is Toyota, the largest-spending high-leverage innovator last year. Toyota continued to perform strongly in 2006, but its R&D spending rose 9.6 percent, to $7.7 billion, or 3.7 percent of the company’s sales (the company’s much-noted ventures in hybrid vehicles and auto electronics may have contributed to this figure). Because it is higher than the industry average of 3.5 percent, that level of spending kept Toyota from being included among this year’s high-leverage innovators.
|
|
In preparation for this year’s edition of the Global Innovation 1000, Booz Allen Hamilton identified the 1,000 public companies around the world that spent the most on research and development in 2006. To be included, companies had to make data on their R&D spending public; all data is based on the last full-year data reported up to June 30, 2007. Subsidiaries that were more than 50 percent owned by a single corporate parent were excluded because their financial results were included in the parent company’s reports. For each of the top 1,000 companies, we obtained key financial metrics for 2001 through 2006: sales, gross profit, operating profit, net profit, historical R&D expenditures, and market capitalization. All foreign currency sales and R&D expenditure figures prior to 2006 were translated into U.S. dollars according to the average 2006 exchange rate. In addition, total shareholder return was gathered and adjusted for each company’s corresponding local market total shareholder return. Each company was coded into one of nine industry sectors (or “other”) according to Bloomberg’s industry designations, and into one of five regional designations, as determined by each company’s reported headquarters location. One category used in our previous years’ studies (technology) was eliminated this year owing to reclassification and provision of more precise data by Bloomberg. To enable meaningful comparisons across industries, we indexed the R&D spending levels and financial performance metrics of each company against their industry median values. To understand how innovation strategy affects performance, Booz Allen sent a survey to a subset of the companies on last year’s list. The responses to this survey were analyzed using a variety of statistical methods. Although company names and responses were kept confidential (unless permission to use them was explicitly given), respondents identified themselves to allow the association of survey answers with financial metrics. Interviews were done with a subset of respondents. Global expenditures on research and development were estimated using data from the World Bank, the Organisation for Economic Co-operation and Development, and the International Monetary Fund. |
Reprint No. 07407
Author profiles:
Barry Jaruzelski (jaruzelski_barry@bah.com), a vice president with Booz Allen Hamilton in New York, is the firm’s lead marketing officer. He has devoted more than 20 years to addressing corporate strategy, organizational transformation, and time-to-market improvement issues in high-technology industries and for manufacturers of highly engineered products.
Kevin Dehoff (dehoff_kevin@bah.com), a vice president with Booz Allen in New York, is the global leader of the firm’s innovation business. He has spent more than 15 years helping clients improve efficiency and effectiveness in product development.
Also contributing to this article were Booz Allen Hamilton Senior Associate Luke Vaccaro, Associate Michael Urban, and s+b Contributing Editor Edward Baker.