
Innovation’s New World Order
Asia is now the top regional destination for R&D spending, followed by North America and Europe. See also Interactive: Where Companies Spend Their R&D Money.

A version of this article appeared in the Winter 2015 issue of strategy+business.
The geographic footprint of innovation is changing dramatically as research and development programs become more global. An overwhelming 94 percent of the world’s largest innovators now conduct elements of their R&D programs abroad, according to the 2015 Global Innovation 1000 study, our annual analysis of corporate R&D spending. These companies are shifting their innovation investment to countries in which their sales and manufacturing are growing fastest, and where they can access the right technical talent. Not surprisingly, innovation spending has boomed in China and India since our 2008 study, when we first charted the global flows of corporate R&D spending. Collectively, in fact, more R&D is now conducted in Asia than in North America or Europe.
Perhaps more unexpectedly, innovation spending in the U.S. has held relatively steady as a share of global innovation spending, despite increases in the amount of R&D that U.S. firms conduct in Asia. This is due in part to companies from other countries increasing their R&D activity in the United States; Silicon Valley, in particular, has been a powerful draw. Innovation spending in Europe, in contrast, grew more modestly and unevenly, with some countries, such as France and the U.K., showing net decreases in domestic R&D spending from 2007 to 2015. More European companies are choosing to expand their R&D operations elsewhere, in both low-cost countries in Asia (defined as countries where the average annual engineering salary is less than US$35,000) and high-cost countries such as the United States.
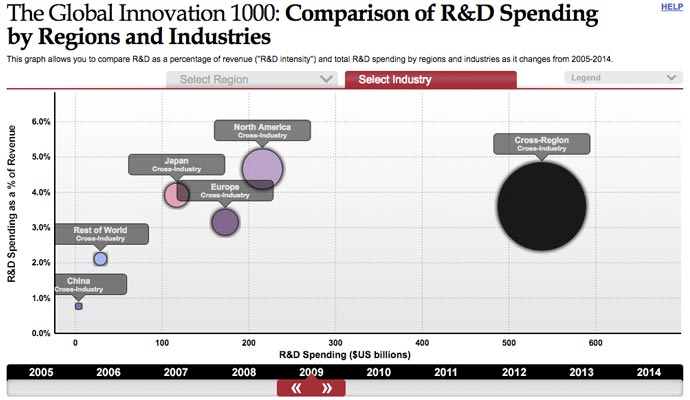
For leading companies, implementing a global innovation strategy is paying off. We found that firms that favor a more global R&D footprint outperform their less globalized competitors on a variety of financial measures. This is important, because, as in previous years, we found no statistically significant evidence that higher levels of spending guarantee better results. Our refrain has long been that it’s not how much you spend on research and development, but how you spend it. But it’s also where you spend that determines your success — and our 2015 study shows that decisions about R&D location look very different today than they did less than a decade ago (see Exhibit 1).
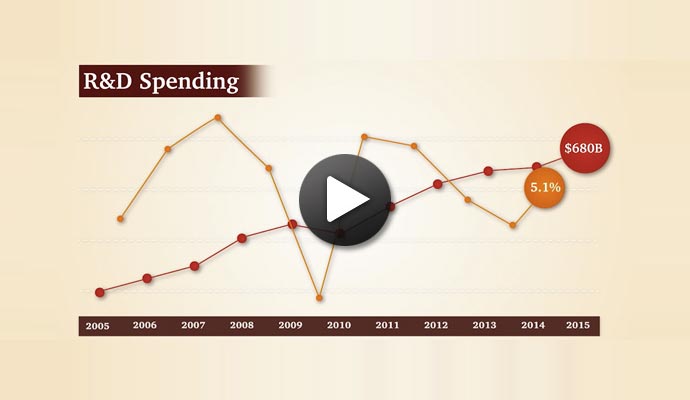
Worldwide, R&D spending by the Global Innovation 1000 companies — the 1,000 public corporations worldwide that spent the most on researching and developing products and services for their markets — rose 5.1 percent to $680 billion in 2015, the strongest increase in the last three years. Companies headquartered in the U.S., Europe, and Japan continued to account for a large majority of innovation spending: 86 percent in 2015 (see “Profiling the Global Innovation 1000”).


Profiling the Global Innovation 1000
The companies in the Global Innovation 1000 spent US$680 billion on R&D in 2015. That represented a 5.1 percent increase from 2014, a year in which R&D spending grew a meager 1.4 percent. The 2015 spending growth marked the largest year-over-year increase since 2011 and 2012, when we reported above-average catch-up gains after the Great Recession. It also indicated a reversion to the long-term trend of R&D spending growth of 5.4 percent demonstrated over the last 10 years.
Revenues for the Global Innovation 1000 would have increased as well, had it not been for the effects of collapsing oil prices on top-line growth in energy firms, which edged overall revenue down by 1 percent. This phenomenon also contributed to a slight rise in R&D intensity, or inno-vation spending as a percentage of revenue, from 3.5 percent in 2014 to 3.7 percent in 2015. Companies tend to stick with their innovation programs despite cyclical revenue fluctuations: R&D spending growth has often outpaced revenue growth for the Global Innovation 1000 (see Exhibit A).
Volkswagen, Samsung, Intel, Microsoft, and Roche led the Global Innovation 1000 in R&D spending, and held the top five positions for the second year in a row. Apple joined the top 20 list at number 18, powered by its sustained growth. AstraZeneca was the other newcomer to the list, at number 20 (see Exhibit B). This is the first time Apple has appeared on the top 20 spenders list. Still, the company is an efficient and effective innovator: It has the lowest R&D intensity of any company on the top 20 list, spending only 3.3 percent of its revenues on R&D, compared with an average of 12.5 percent for the other 19 companies on the list. In addition, Apple’s R&D intensity is less than one-third the 11.8 percent average intensity of its competitors in the computing and electronics industry.
Among industries, the computing and electronics, healthcare, and auto sectors continued to spend the most on R&D. In total, they accounted for 62 percent of total Global Innovation 1000 R&D spending (see Exhibit C). However, R&D spending by computing and electronics companies fell 0.7 percent in 2015, whereas R&D spending by healthcare companies rose 6.0 percent (see Exhibit D). The healthcare sector is closing in on the number one position; if the current trend continues, the industry will be the largest R&D spender by 2019.
But the biggest movers among industries have been software and Internet companies. The industry increased R&D spending by 27.4 percent between 2014 and 2015. Software and Internet also had the largest average growth of any industry over the last 10 years — 13.2 percent — and passed industrials in 2015 to become the fourth-largest industry in terms of R&D spending. This rank change happened despite the fact that industrials companies posted the second-largest year-over-year increase, at 8.9 percent, and the third-highest 10-year average increase, at 6.3 percent.
From a regional perspective, companies headquartered in North America, Europe, and Japan continued to dominate the Global Innovation 1000. But their share of R&D spending has fallen from 96 percent in 2005 to 86 percent in 2015. North American companies’ share edged down from 42 percent to 40 percent; European companies’ share was flat; and Japanese companies lost the most, falling from 24 percent to 16 percent of the total.
During the last decade, innovators headquartered in other regions, notably in China and the “rest of world” category (which includes countries such as Brazil, India, and Israel), increased their share of the Global Innovation 1000 spending substantially — from 3 percent in 2005 to 14 percent in 2015.
Companies headquartered in these countries now represent 227 of the Global Innovation 1000, compared with 64 companies 10 years ago. Companies based in China, in particular, increased their spending by 31.6 percent in 2015 (see Exhibit E). And over the last decade, Chinese companies increased their R&D spending by more than 3,000 percent. Moreover, as we’ve noted, measuring innovation spending by where companies are headquartered as opposed to where the innovation work is actually done significantly understates the major shift of innovation activity to Asia.
The 10 Most Innovative Companies
Apple and Google still rule as the world’s most innovative companies, according to our 2015 Global Innovation 1000 survey (see Exhibit F). This one–two showing has been consistent since we began asking participants to identify the top innovators six years ago. Apple continues to set new production records for iPhones and computers, and burst into an entirely new market with the debut of the Apple Watch. Meanwhile, Google’s paradigm-changing self-driving car project continues to generate buzz, as do its experiments with solar-powered drones for providing Internet services in remote areas. In August 2015, the company introduced its Alphabet holding company structure to better facilitate focus and innovation across its growing portfolio.
Tesla Motors, which first joined the most innovative list in 2013 in ninth position and moved up to number five last year, jumped to third place in 2015 — just above Samsung, which held its place at number four. Tesla introduced a “ludicrous mode” option for its Model S roadster this year, enabling it to accelerate from zero to 60 miles per hour in 2.8 seconds, and announced that its planned US$4 billion-plus battery “Giga-factory” will be producing more auto power packs by 2020 than the total world production in 2013.
Amazon, first voted onto the most innovative list in 2012, placed fifth in 2015. The sixth spot again went to 3M, which has been in the top 10 in each of the last six years — proving that innovation executives aren’t impressed only by shiny digital devices, futuristic cars, and online dominance. Next were perennial top 10 members GE, Microsoft, and IBM. Toyota rejoined the list, in 10th place, after dropping off in 2013 and 2014. This is the first year that two auto companies were voted most innovative. For the sixth year running, no pharmaceutical company made the top 10, even though the industry continues to be well represented in the Global Innovation 1000.
As in all previous years, the 10 most innovative companies outperformed the 10 biggest R&D spenders on revenue growth, EBITDA as a percentage of revenue, and market-cap growth (after normalizing for industry variations) (see Exhibit G).
Although much remains the same when it comes to the most innovative list, change may be on the horizon. Apple’s margin of victory narrowed in 2015. As high a proportion as 80 percent of respondents named Apple number one in past years, but only 62 percent did so this year — opening the door for new companies to move into top positions, or to enter the fray.
But we know that analyzing global innovators based solely on where their headquarters are located doesn’t reveal where the actual work of innovation is being done. To analyze the flows of R&D spending among regions and countries, we researched the innovation activities of 207 companies in 23 countries conducting R&D at 2,041 sites in more than 60 countries (see Methodology). This sample of major innovators accounts for 71 percent of the total Global Innovation 1000 spending.
Methodology
As it has in each of the past 10 editions of the Global Innovation 1000, this year Strategy&, PwC’s strategy consulting business, identified the 1,000 public companies around the world that spent the most on R&D during the last fiscal year, as of June 30, 2015. To be included, companies had to make their R&D spending numbers public. Subsidiaries that were more than 50 percent owned by a single corporate parent during the period were excluded if their financial results were included in the parent company’s financials. The Global Innovation 1000 companies collectively account for 40 percent of the world’s R&D spending, from all sources, including corporate and government sources.
In 2013, Strategy& made some adjustments to the data collection process in order to gain a more accurate and complete picture of innovation spending. In prior years, both capitalized and amortized R&D expenditures were excluded. Starting in 2013, we included the most recent fiscal year’s amortization of capitalized R&D expenditures for relevant companies in calculating the total R&D investment, while continuing to exclude any non-amortized capitalized costs. We have now applied this methodology to all previous years’ data; as a result, historical data referenced in the studies from 2014 onward will not always align with previously published figures for the 2005 through 2012 studies.
For each of the top 1,000 companies, we obtained from Bloomberg and Capital IQ the key financial metrics for 2010 through 2015, including sales, gross profit, operating profit, net profit, historical R&D expenditures, and market capitalization. All sales and R&D expenditure figures in foreign currencies were converted into U.S. dollars according to an average of the exchange rate over the relevant period; for data on share prices, we used the exchange rate on the last day of the period.
All companies were coded into one of nine industry sectors (or “other”) according to Bloomberg’s industry designations, and into one of five regional designations, as determined by their reported headquarters locations. To enable meaningful comparisons across industries, the R&D spending levels and financial performance metrics of each company were indexed against the average values in its own industry.
To understand the global distribution of R&D spending, the drivers of that distribution, and how the distribution affects the performance of individual companies, we researched the global R&D footprint of the top 100 companies in terms of their 2015 R&D spending, plus the top 50 companies in the largest three industries (auto, healthcare, and computing and electronics) and the top 20 companies in the industrials and software and Internet sectors. The total number of companies for which we assessed the distribution of R&D spending across countries was 207, reflecting overlap in the top 100 and the five selected industries. These 207 companies are headquartered in 23 countries and conduct R&D activities at 2,041 R&D sites in more than 60 countries.
When geographic breakdowns were not publicly available, we collected data on the location of R&D facilities, the product segments each facility supports, the year each facility was established, the number of people each facility employs, sales by product segment, and global distribution of sales. This data was used to allocate total R&D dollars to the countries where facilities were located.
Finally, to understand the ways in which global R&D is and will be conducted at companies across multiple industries, Strategy& conducted an online survey of 369 innovation leaders around the world. The companies participating represented more than US$106 billion in R&D spending, or 16 percent of this year’s total Global Innovation 1000 R&D spending, all nine of the industry sectors, and all five geographic regions.
To describe location and flows of innovation spending, we use the terms in-country (or in-region) spending, exports, and imports as a convenient shorthand. A multinational that spends a third of its R&D budget outside its headquarters country is thus considered to be exporting 33 percent of its R&D spending. The disadvantage of using this terminology is that the concepts of importing and exporting are antithetical to the concept of a multinational corporation, which by definition conducts business globally rather than nationally. It can also be potentially misleading, in that mergers and acquisitions can alter the export and import numbers even though the location of past innovation activity does not change.
More corporate R&D is now conducted in Asia than in North America or Europe.
Still, this type of analysis provides an accurate gauge of where innovation activity is being conducted around the world, and how corporate management makes R&D investment decisions. It also provides a way to chart the relative gains and losses across countries and regions.
As a complement to our study, we asked global innovation executives about both their companies’ experiences with global innovation and their views on successful innovation practice. The 369 respondents to the Web survey represented companies that collectively accounted for more than $106 billion in R&D spending — 16 percent of the Global Innovation 1000 total. We also conducted in-depth interviews with a select group of senior innovation leaders to hear firsthand how the global innovation model has evolved.
Given the pervasiveness of globalized innovation and the performance premium that a globalized footprint provides, the benefits for companies are obvious. But executing such a strategy comes with challenges, and a set of best practices has emerged to help innovation leaders manage them. It’s critical that they do so, because the best opportunities are now scattered far and wide. “One of the lessons learned over the years is that innovation does not have borders,” observes Philippe Keryer, chief innovation and strategy officer at France-based telecom equipment giant Alcatel-Lucent, which specializes in IP networking, ultra-broadband access, and cloud technology. “And we need to be careful, because the next generation of disruptive technology will not necessarily come from the same place as the last one.”
The R&D Boom in Asia
The most dramatic change in global flows of innovation spending has been Asia’s rise as the number one location for corporate R&D. In 2015, Asia accounted for 35 percent of the global total for the 207 largest spenders, surpassing both North America (33 percent) and Europe (28 percent). This is the total of “in-region” R&D spending, including both spending by local companies and R&D spending imported from other regions. In 2007, Europe was the leader, followed closely by North America.
In 2007, the majority of R&D spending in Asia, North America, and Europe all came from domestic firms (in each region). In 2015, Asia became the only one of the three to see the balance shift. Fifty-two percent of its R&D spending was imported — done by firms headquartered outside the region. Such innovation activity in China and India has been central to Asia’s rise. Between 2007 and 2015, R&D spending in China increased by 120 percent, to $55 billion, making it the second-largest location for corporate R&D, passing Japan and Germany ($50 billion and $32 billion, respectively). Although the U.S. retains its top position with $145 billion, its lead is narrowing: In 2007, R&D in China was 23 percent of the U.S. total. In 2015, it amounted to 38 percent of the U.S. total.
Between 2007 and 2015, corporate R&D spending in China increased by 120 percent to $55 billion.
China’s imports of R&D from multinationals headquartered in other countries were $44 billion in 2015 — 81 percent of the $55 billion in-country total (see Exhibit 2). That’s up from $25 billion in 2007, when virtually all R&D in China was imported, because only one Chinese company was included in our sample of top innovators that year. By 2015, 11 more Chinese companies had joined the sample. Together these 12 companies spent $10 billion domestically. The U.S. led in exports of R&D to China in 2015, accounting for 39 percent of inflow, followed by Japan (20 percent) and Germany (10 percent).
Our survey respondents cited proximity to a high-growth market as the top reason for moving R&D to China (71 percent), followed by proximity to key manufacturing sites (59 percent), proximity to key suppliers (54 percent), and lower development costs (53 percent). “We have to acknowledge that China is the workbench of the world,” says Siegfried Russwurm, chief technology officer and member of the managing board at the global industrial and technology company Siemens, headquartered in Germany. “We made a conscious decision that we need to be close to this promising market with our product definition, product design, and engineering.”
Russwurm notes that typical Western-designed high-end products often don’t resonate in China. “Our colleagues in China have open access to all the technology that Siemens owns, and [they] design products with distinct functionality as needed for their markets — at a fabulous cost position, using Chinese suppliers, and perfectly fitted to China’s needs.” Russwurm says that innovation from Siemens’s Chinese R&D facilities has enabled the company to offer some of these products, such as simpler computerized machine controllers, in Western markets, capturing new market segments at lower price points than many customers would have expected from the company.
Chinese firms are now also exporting R&D spending. Although China’s total R&D exports in 2015 were a modest $2.0 billion, some leading Chinese companies have become global brands — and are setting up global R&D operations. Consumer electronics and home appliance company Haier, for example, established an R&D center in Japan after its acquisition of Sanyo’s appliance business from Panasonic in 2011. It has since opened R&D hubs in Germany and the U.S., as its business has grown in Europe and North America.
In 2012, Haier acquired New Zealand–based appliance manufacturer Fisher-Paykel, including its product development center for kitchen appliances. Working with Haier’s main innovation center at the firm’s Qingdao headquarters, says Wang Ye, vice president of Haier Appliance Industry Group and general manager of Haier Global R&D, each global R&D center functions as “a platform to exchange resources and to connect with global channels — including more than 200 universities, 100 technology incubators, and thousands of tech companies, and, of course, local governments. All these resources continue to offer ideas and solutions for our end customers.” One example that Wang cites: Haier’s Qingdao innovation headquarters collaborated with the New Zealand center to combine technologies in electric motors and drum washing machines. The resulting product — the Intelius line of premium washing machines — has become a sales leader in New Zealand and commands 30 percent of China’s market for premium washing machines.
The rise of India as an R&D force has also been impressive. Total corporate R&D conducted in India increased 115 percent between 2007 and 2015, to $28 billion. The growth was powered by R&D spending from other countries, which grew 116 percent. India, not surprisingly, is the largest global destination for software R&D. Multinationals that have moved R&D to India cite a variety of reasons for the move, and cost is often not the most important. “Our tech center in India gives us an around-the-clock capability to accelerate development work due to the time difference with the U.S.,” says Denise Ramos, chief executive officer of ITT Corporation, a U.S.-based manufacturer of specialty components for the aerospace, transportation, energy, and industrial markets. “The highest priority was access to technical talent that was in close proximity to regional customers. The fact that some of the labor is lower-cost was nice to have, but not a primary driver.” India moved from seventh to fifth among all countries in terms of total in-country R&D in 2015, surpassing the U.K. and France.
Elsewhere in Asia, South Korea’s in-country R&D grew 98 percent between 2007 and 2015, moving it into eighth place, ahead of Israel, Italy, and Canada. Japan fell from second to third place, despite a 24 percent growth in in-country R&D between 2007 and 2015. Japan decreased the amount of R&D exported to the U.S., moving it largely to “nearshore,” low-cost China. Japan’s imports of R&D rose 74 percent, mainly as a result of imports from South Korea and Europe.
The U.S.: Leading, but Losing Ground
The U.S. held its position as the number one location for innovation, with total in-country R&D spending of $145 billion in 2015, despite the fact that U.S.-headquartered companies exported $121 billion in R&D in the same year. Much of this exported R&D went to lower-cost countries, particularly in Asia. India and China led as destinations for U.S. exports, each with 15 percent of the total. This represents a significant change since 2007, when the U.K. was the top destination for U.S. R&D exports. France was also among the top 10 destinations for U.S. exports in 2007, but has since been surpassed by South Korea. A helpful way to visualize how relative advantage has changed between countries from 2007 to 2015 is to look at the change in each country’s total in-country R&D spending compared with that of the United States, which remains the largest location for R&D (see Exhibit 3).
The in-country R&D total in the U.S. was supported by a 41 percent increase in R&D spending by U.S. companies from 2007 to 2015 (to $93 billion) — and by a 23 percent rise in R&D imported from other countries, to $53 billion. Over the past decade, some policymakers, analysts, and business leaders have voiced concerns about a “hollowing out” of U.S. industry, fearing that R&D would be exported to low-cost countries in the same way that much of the U.S. manufacturing industry was offshored in the 2000s. And although the United States has seen increased R&D exports, the effect was muted by the rise in imports. The biggest gains came from imports from European companies, which have invested heavily in the U.S. and provided 63 percent of the U.S. total in 2015. R&D imports from Germany, for example, rose 121 percent between 2007 and 2015. Germany is now the leading source of U.S. imported R&D, surpassing Japan, which led by a wide margin in 2007.
The surge of U.S. R&D imports from Europe underscores the fact that cost is typically not the main driver in R&D location decisions. After all, the U.S. is a high-cost country for R&D — in many cases it carries higher costs than European countries. (Nor were companies headquartered in other countries coming to the United States for tax benefits; see “Tax Policy: Where the U.S. Is Not Number One.”) European companies instead came to the U.S. for proximity to their markets and operations, for access to talent and technology, and to take advantage of the United States’ culture of innovation — in particular in Silicon Valley.
Tax Policy: Where the U.S. Is Not Number One
by Barry Jaruzelski and Jeffery Jones
When innovation leaders consider where in the world to locate an R&D facility, tax incentives are typically less important than seven other attributes, such as access to talent, proximity to customers, market insight, and operating costs, according to the 2015 Global Innovation 1000 survey respondents. At the same time, however, tax deals can have a positive effect at the margin. “It’s icing on the cake, but not the primary driver,” says Denise Ramos, CEO of ITT Corporation.
Back in 1981, in the early days of the Reagan administration, the U.S. became the first country to offer a tax credit for R&D spending. But other nations were quick to copy the idea, and many went on to offer far more attractive and extensive tax benefits. A 2013 study by the Organisation for Economic Co-operation and Development (OECD) measured the generosity of R&D tax incentives for 31 countries, and found that the U.S. ranked 22nd.
Moreover, the U.S. government has often kept corporate America guessing, authorizing the R&D tax credit for only a year or two at a time. The U.S. Congress has even let the credit lapse several times, usually resurrecting it later and making the benefit retroactive.
The Silicon Valley Tax Directors Group — a trade association of 79 innovation leaders, most of them U.S. companies — has been pushing for an overhaul of the U.S. corporate tax code in general and for a permanent and enhanced R&D tax credit in particular. Current U.S. policies, according to the group’s position statement, encourage “the migration of research and development activities to other countries with more predictable, more favorable tax treatment.”
It is impossible to know how much of U.S. companies’ R&D exports might have been avoided if tax incentives had been more generous and certain. But as the globalization of R&D continues, and as more countries compete for innovation leadership, it’s a topic well worth revisiting by U.S. policymakers.
- Jeffery Jones is the U.S. R&D tax services practice leader at PwC US.
For pharmaceutical companies, for example, one of the attractions of the United States is its extensive and coherent innovation ecosystem, says Mikael Dolsten, president of worldwide research and development at U.S.-based pharma manufacturer Pfizer. “The National Institutes of Health is the largest biomedical institute in the world, and has traditionally provided significant funding,” says Dolsten. “Although that funding has eroded somewhat in recent years, it remains a cornerstone for academic research, and has set a strategic direction for the U.S. There are strong academic laboratories, a vibrant biotech industry, global pharmaceutical companies, and strong engagement from philanthropic organizations and patient foundations.”
Adds Russwurm of Siemens: “The U.S. is attractive for global R&D for several reasons other than the proximity to its large and growing market. One is that digital skills are becoming more and more important. You get good results with people who are true digital natives, and there are more of them in the U.S. than anywhere else. Another is the openness of U.S. society toward innovation. If you look at the car industry, for example, autonomous driving is a major area of interest for innovation. The regulatory circumstances and approach to innovation are more favorable in the U.S. than in Europe, and that is a force driving more innovation activity in the United States.”
Europe Slipping
The hollowing out of innovation capabilities is happening more noticeably in Western Europe, which has seen the steepest fall in R&D activity. Between 2007 and 2015, net European exports of R&D to other regions — exports minus imports — grew by 352 percent. At the country level, Germany was Western Europe’s biggest net exporter, followed by Switzerland. France and Sweden, both net R&D importers in 2007, were net exporters in 2015. As a result, Europe’s total in-region R&D spending fell from 35 percent of the world total in 2007 to 28 percent in 2015. Overall, companies in Europe conducted 57 percent of their R&D inside Europe in 2007, but only 48 percent in 2015. The U.S. was the largest export destination, despite having higher engineering direct labor costs than most European countries.
Companies in Europe did 57 percent of their R&D inside Europe in 2007, but only 48 percent in 2015.
Germany — Europe’s biggest economy — is a case in point: In-country R&D spending rose a modest 15 percent between 2007 and 2015. German companies’ R&D exports totaled $35 billion in 2015, which more than doubled their domestic spending. Meanwhile, Germany’s overall R&D imports fell. France’s R&D performance was similar, but even weaker. Total in-country R&D spending in France fell by 21 percent between 2007 and 2015, as French companies’ exports of R&D rose 46 percent and total French imports fell by 21 percent (see Exhibit 4). The largest destinations for French R&D exports were the U.S. (28 percent), China (13 percent), Germany (8 percent), and India (7 percent).
The R&D portfolio of Western European countries has shifted significantly as a result of these changes. Spending in home countries declined from 32 percent of all European R&D to 29 percent. Western European companies’ spending in nearshore, high-cost European countries fell from 23 percent to 16 percent, while their spending in offshore, high-cost countries, such as the U.S. and Japan, rose 46 percent.
Part of the rise in exports of R&D from Europe is due to the M&A activities of European multinationals. When a multinational merges with or acquires another company, it also acquires the company’s R&D personnel and facilities — typically continuing those operations and integrating them into its overall innovation program. After a major acquisition of a U.S. firm, the acquired U.S. R&D activities are counted as exports in our study even though the location of the work has not changed. Thus the R&D assets included in Fiat’s $4.3 billion acquisition of Chrysler, completed in 2014, or those in Siemens’s recent $7.6 billion purchase of the U.S. oilfield equipment maker Dresser-Rand Group add to the “export” totals. What’s more worrisome for Europe’s overall position in R&D is the decline of in-region R&D spending.
Meanwhile, low-cost Eastern European countries increased their imports of R&D by 53 percent between 2007 and 2015 (compared with 15 percent growth for Western European countries), to $14 billion; these countries were led by Russia, Poland, and Romania. Imports from the U.S. made up half the total, and imports from Western Europe made up another 29 percent. If Eastern Europe were ranked as a single country, it would be the eighth-largest spender on R&D, roughly equivalent to South Korea.
High-cost European countries nevertheless remain a major force in global innovation, with advantages that include proximity to their large market of wealthy consumers, highly talented and skilled workers, and, in many industries, significant public-sector support for R&D — all of which make it appealing to do innovation work in the region.
“We’ve seen increasing investment in pharmaceutical R&D in Europe as a result of European Union funding through the Innovative Medicines Initiative,” says Dolsten of Pfizer. “It has fostered industry and academic partnerships, and provided E.U. funding, which the industry has matched. Another attraction is that Europe has a more integrated healthcare system, so there are large clinical databases that help us understand the impact of disease on populations. Some European countries have very sophisticated electronic medical records systems, which enable us to use big data effectively.”
Other innovation leaders also cite the availability of sophisticated and deep talent pools in Europe, as well as proximity to its large and wealthy market. Some, however, point to Europe’s relatively restrictive labor laws and trade unions as a disadvantage for conducting R&D, compared with other regions.
The Global Footprint Premium
Regional shifts aside, one truth remains constant across all geographies and industries: Companies that overweight their R&D spending outside their headquarters country continue to outperform their less globalized competitors. Companies that deployed 60 percent or more of R&D spending abroad in 2015 earned a premium of 30 percent on operating margin and return on assets, and 20 percent on growth in operating income, over their more domestically focused competitors. This finding was similar to the results of our 2008 study, suggesting that there continues to be a payoff from the deployment of capabilities and capacity on a global scale, and greater success in understanding and meeting local market needs.
In both this year’s study and our 2008 analysis, companies whose share of R&D assets invested overseas was greater than their share of overseas sales outperformed companies whose corresponding share was lesser in return on assets, operating margin, and total shareholder returns. We also found that companies that allocate a greater share of their R&D spending to lower-cost countries outperformed their competitors by 20 percent on gross profit and 10 percent on sales growth.
Moreover, companies have become more proficient at managing global innovation networks. In our 2008 study, for example, we found that companies with highly focused footprints (those with the smallest number of global R&D sites, relative to sales) tended to outperform companies with more fragmented global R&D operations consisting of numerous smaller sites. Evidently they found it easier to manage teams in person than via conference or video calls and collaboration tools. In this year’s study, companies with dispersed global R&D operations are performing as well as or better than companies with focused footprints. This suggests that multinationals have become more experienced at coordinating projects across global sites, and that the digital collaboration tools available have improved markedly and companies have become more adept at employing them. These changes afford multinationals the best of both worlds: the ability to locate their R&D facilities close to their markets and the ability to access the best talent at optimal cost levels, all without compromising efficiency.
On average, the 207 companies in our global footprint sample export R&D to about six countries, and the figure hasn’t changed much since 2007. When we ranked companies in quartiles based on their degree of R&D globalization, companies in the top quartile increased the number of countries to which they export R&D by just 7 percent, from an average of 13.5 in 2007 to an average of 14.5 in 2015. The companies in the bottom quartile increased this number by 67 percent, from 1.0 countries on average to 1.7. When we looked by region, U.S. companies reduced the number of countries to which they export R&D modestly, while the average number for European companies increased moderately. Among industries, the average number of countries to which companies export R&D increased the most in the auto sector.
Both models of globalized innovation — a limited number of more concentrated R&D facilities, and widely dispersed operations — can be effective. And different companies have different preferences. Alcatel-Lucent, for example, finds that a smaller number of R&D sites is more efficient for development activities. “In development, there is always a trade-off between localization and complexity,” says Keryer, the company’s chief innovation and strategy officer. “As part of our current corporate strategy, we are deemphasizing subscale development sites to create more efficiency, and are concentrating on a set of anchor points — big and diverse development centers.” For research and innovation, on the other hand, Keryer states that talent pools are the more important consideration. “Smaller and more dispersed teams can be effective,” he says, “whether it is California for Internet protocol, Israel for cloud, the East Coast of the U.S. or Europe for optics, France for mathematics — or China, which is becoming an important place for innovation, in particular in wireless and optics.”
Managing a Dispersed Network
Establishing a global R&D model has become a standard requirement for large corporations that want to be competitive in today’s marketplace. But it comes with a unique set of complexities. Our survey respondents cited a variety of challenges in conducting R&D outside their home countries, with “finding and retaining top talent” and “protecting intellectual property” most often named (and most particularly in China). Other challenges included quality and customer focus, risk and project management, and cultural differences.
The good news is that leading innovators are finding ways to manage these and other complexities. To ensure the long-term success of a globally dispersed R&D footprint, company leaders should focus on the following imperatives:
• Company leaders must clearly articulate, as part of the overall business strategy, the role that innovation plays in the company’s mission. How central is innovation to the company’s competitive advantage?
• The centrality of innovation in the company’s competitive advantage should inform the organization’s global footprint. In the absence of a holistic view, R&D sites can proliferate as a result of one-off decisions and acquisitions and lead to a loss of focus. Companies should also consider the specific needs of each phase of the innovation life cycle. For example, in the idea-generation phase, companies may benefit from setting up smaller, more agile teams where the top talent is located. For product development, larger centers can take advantage of scale and lean principles.
• Companies need to define the geographic markets and the customers within those markets that are central to the company’s growth strategy, and then determine where R&D resources need to reside so the company can best understand and serve those markets. Different types of companies may have different approaches (see “The Three Innovation Models”). For Need Seekers, for example, the key consideration may be locating R&D facilities as close to customers as possible, whereas Market Readers, as second movers, may have more flexibility to base location decisions on cost. Technology Drivers may need to keep R&D more centralized to maintain their focus on technological breakthroughs.
The Three Innovation Models
In 2007, the Global Innovation 1000 study identified three fundamental kinds of companies, each with its own distinct way of managing the R&D process and its relationship to customers and markets. Need Seekers, whose strategy is to ascertain the needs and desires of consumers by engaging them directly, strive to be the first to market with breakthrough products and services. Market Readers, who tend to watch their customers and competitors closely, create value by incremental change and capitalizing on market trends, using a second-mover strategy to keep risks low. Technology Drivers, who leverage their R&D to propel both breakthrough innovation and incremental change, develop original products and services via new technology.
As part of our 2015 survey, we asked respondents from all three types of companies about the challenges they face in implementing global innovation models. Most reported similar concerns, with a few key differences: Intellectual property protection and quality control were paramount for Need Seekers, whereas finding and retaining top talent was of greatest concern for Market Readers and Technology Drivers.
• To ensure operational excellence, leaders must create clear missions, roles, and lines of authority to align the dispersed R&D sites with the company’s innovation strategy. Here, leadership needs to invest in the digital tools and related processes that have enabled the best companies to manage such areas as resource deployment, project collaboration, project green-lighting, portfolio ownership, strategic and operating metrics, and transparency mechanisms across a global network.
• Companies have to create a global talent management strategy. Increasingly, the people with the skills that companies need are going to be found outside the Western countries where management may have looked most frequently in the past. Companies need common standards for talent development and retention that can be applied at each of their global centers. They should also rotate their top engineering talent, to give future R&D leaders a more global perspective and understanding of the company’s innovation capabilities.
• Company leaders must foster a corporate culture that supports the company’s innovation strategy and encourages collaboration among centers worldwide. Specifically, aligning the intangibles of culture — such as risk, creativity, and openness — is critical to success when R&D activities are dispersed globally.
As companies further develop and optimize their global innovation networks, they will continue to tap into more diverse global talent pools, a wider knowledge base, and deeper insights into growing markets. With the right implementation, the globalization of R&D will benefit the search for breakthrough innovations, and enable companies to make bigger-bet portfolio choices than they have in the past.
Reprint No. 00370
Author profiles:
- Barry Jaruzelski is a thought leader on innovation for Strategy&, PwC’s strategy consulting business. Based in Florham Park, N.J., he is a principal with PwC US. He works with high-tech and industrial clients on corporate and product strategy and the transformation of core innovation processes. He created the Global Innovation 1000 study in 2005, and in 2013 was named one of the “Top 25 Consultants” by Consulting magazine.
- Kevin Schwartz is a principal with PwC US, and leads the firm’s innovation and development consulting services. Based in San Francisco, he focuses on driving enterprise-wide innovation and enabling growth through new products, services, and business model innovations.
- Volker Staack is a leadining practitioner for Strategy&. He is a principal with PwC US. He focuses on engineered products and services, particularly in the automotive and heavy equipment industries, and specializes in strategic product value management, turnarounds, and implementation of global M&A.
- Also contributing to this article were s+b contributing editor Rob Norton, Strategy& campaign manager Kristen Esfahanian and senior associate Spencer Herbst, and PwC manager Vivek Shrivastava.
