The Global Innovation 1000: Navigating the Digital Future
Booz & Company’s annual study of R&D spending reveals the tools that are transforming innovation—from customer insight to product launch.

Illustration by Craig & Karl
At Catalent, a U.S.-based producer of pharmaceutical products and provider of advanced drug delivery technologies and services, digital tools often support the practices of the company’s 18 research and development sites around the world. Data pours in from R&D, sales and marketing, operations, quality assurance, and regulatory affairs, as well as customers. Evjatar Cohen, vice president for global innovation and portfolio management, and his team make sense of it all with a slate of new market and customer insight enablers. “Collecting the data is just part of what we do,” he says. “It’s really about using that input to come up with market uptake estimates for each potential product and an understanding of its business value. That aids us greatly in deciding where to focus our day-to-day activities as well as planning our long-term strategy.”
The 2013 Global Innovation 1000: Navigating the Digital Future:
Learn More
More insights from the 2013 study are available on strategy-business.com and strategyand.pwc.com, including:
- The Digital Tool Landscape: An interactive graphic about the tools that are transforming innovation.
- Video interviews with the study’s authors: Barry Jaruzelski, John Loehr, and Richard Holman discuss the results of Booz & Company’s 2013 Global Innovation 1000 Study.
- Infographic: Top 20 R&D Spenders 2005–2013: An interactive look at the 20 publicly traded companies worldwide that spent the most on R&D over the past nine years.
- Infographic: Comparison of R&D Spending by Regions and Industries: An interactive graphic comparing region and industry R&D spending by all Global Innovation 1000 companies over the past nine years.
You can also find Booz & Company’s past studies here.
Catalent’s story is similar to that of other leading companies around the world. To enhance the front end of their innovation process, more and more R&D teams are using new tools such as software programs that mine and analyze “big data” and customer immersion labs that use digital reality to simulate experiences. “The earlier in the process you are,” says Cohen, “the more uncertainties and hurdles there are to manage”—and the new digital tools are ideal for confronting uncertainty and surmounting hurdles. Although they have not yet been widely adopted or tested, these tools are already enabling some companies to first gather a better and deeper understanding of customers’ needs and engage them in the design process, and then monitor their products’ use after launch to capture data that can be fed back into the innovation process.
These new digital tools are fostering change, but not in isolation; they are joining another group that has been around for years and is already well established at most companies. Productivity enablers such as computer-aided design (CAD) software used in the design and tooling stages of product development and project management tools that help track time lines, workflows, milestones, and spending have a long track record of helping companies boost the efficiency of their innovation processes—particularly at the back end when they are developing products.
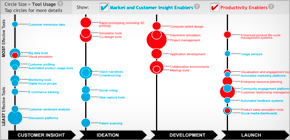
The result? Digital tools are influencing every stage of the innovation life cycle: from collecting and analyzing customer insights, to generating and vetting ideas, to designing and manufacturing new products, and, finally, to tracking products’ success once launched (see Exhibit 1). As part of this year’s Global Innovation 1000 study, our ninth annual analysis of R&D spending, we took a closer look at these digital tools, both old and new, to determine what’s being used most widely and what’s working most effectively (they aren’t always one and the same). We found that companies have a real opportunity—perhaps even an imperative—to rethink their digital tool kit. Indeed, we are seeing the first signs of a digital revolution that will transform how innovation is done. As with all revolutions, both breakthroughs and dead ends will make an appearance along the way. And there can be a tendency to get caught up in the hype. But make no mistake—digitization will change innovation, and companies should act now to avoid being left behind.
Click here for an interactive version of The Digital Tool Landscape.
Many are already taking action: Executives at the more than 350 companies we surveyed say they currently spend 8.1 percent of their R&D budgets on digital tools, suggesting that of the US$638 billion spent on R&D by the Global Innovation 1000 in 2013, about $52 billion was invested in digital enablers. But as we know from our ongoing annual studies of R&D spending, when it comes to successful innovation, what really counts is not how much money you spend, but how you spend it. Our 2013 study found that respondents whose companies made significant use of these digital enablers were 77 percent more likely to report that they outperformed competitors than were those with low or moderate usage rates (see Exhibit 2). However, because our results revealed that usage of digital tools does not necessarily correlate with the tools’ effectiveness, companies need to choose the enablers that are right for their company and that align with their overall innovation strategy. Digital tools are only as good as the underlying innovation process they support. Those companies that understand that are poised for success.
The Customer Insight Advantage
The new entrants in the digital tool kit tend to appear more frequently in the earlier stages of the innovation process, when gathering feedback and insights from consumers and customers can lead to better decisions that will reverberate throughout the life cycle of product development. When it comes to these new tools, we often find that fewer companies are using them (especially as compared to the more established productivity tools). But these lower usage rates reflect the fact that many of these tools are still untested, and many companies are just dipping their toe in the water.
Customer immersion labs, for example, are used by only 14 percent of companies, but those few already find them highly effective. These labs enable companies to gather reactions and data on new product designs directly from individuals using them by providing a digital, simulated experience. At construction and mining equipment manufacturer Caterpillar, they have become an integral part of the early stages of research and development. Chief technology officer Gwenne Henricks says that the company “makes significant use of immersive visualization, where we can bring in customers, service technicians, or assemblers from the assembly line and expose them to three-dimensional, real-time virtual depictions of new product designs. It’s here that we are able to capture their feedback [in terms of] usability, serviceability, manufacturability, and the like—all of those design aspects of our product that involve interactions with humans.”
Automated product usage tools, or sensors, are used by just 14 percent of our respondents, but have proven quite effective for some companies. They enable companies to passively collect and analyze product or service usage data direct from the customer via automatic tracking technologies. One example is Salesforce.com, a leading cloud provider of customer relationship management services. Because all its products are cloud-based, the company has great visibility into how customers use them. That means that rather than developing and releasing new versions of its products every two or three years, Salesforce.com can update its products every quarter. Says Bill Blau, senior director of partner marketing and strategic alliances, “Every time someone logs in to something or clicks on something, we can see what fields they’re using, what fields they aren’t using, how much data they’re putting in the system. We’re constantly getting that from more than 100,000 customers.”
Other market and customer insight tools, such as software used to analyze big data and to profile customers, are more commonly used and also rated highly in terms of effectiveness. One-third of our survey respondents say their companies are employing these tools to exploit their massive pools of structured and unstructured data and gather insights into customers.
For example, at healthcare giant Aetna, the company’s ability to analyze that data provides it with enormous leverage in developing new products designed to cut the cost and improve the quality of healthcare. The company’s head of innovation, Michael Palmer, cites a striking example: Up to one-quarter of the U.S. population has metabolic syndrome, which, left untreated, is associated with a significantly increased risk of stroke, heart attack, and death. Aetna engaged in a data analysis exercise that determined which of the five component factors of metabolic syndrome had the greatest impact on future health risks and costs. This work led to the development of a predictive model that identifies which individuals are most likely to develop metabolic syndrome in the future, including which specific individual risk factors they are most likely to develop next. This information can now lead to the development of more effective, targeted clinical strategies to mitigate future clinical risks and costs associated with metabolic syndrome. “That helps corporate healthcare plan sponsors decide where their best bang for the buck would be if they’re trying to decide on which program to use to improve the health of their employees,” Palmer explains. “And it encourages employees who have one or more of the factors to be more engaged in trying to reduce the risk.”
Meanwhile, Philips Lighting, a maker of commercial lighting systems for large-scale installations, can outfit (with the customer’s permission) each light fixture in a system with technology that gathers data such as hours used, dimming level, sensor switches, motion detectors, and the like, and sends it back to a central information system. “Eventually,” says Bob Esmeijer, head of Philips Professional Lighting Solutions NA, “we’ll be able to use that information to develop lights that do the work themselves—that can sense the amount of light coming in from outside and how much activity is in the room, and adapt accordingly.”
Crowdsourcing—opening up idea generation to sources inside and outside the company—is another tool with fairly high usage rates (it’s used by 41 percent of respondents). And although respondents had mixed reviews on its effectiveness, anecdotal evidence shows that it has the potential to help companies engage with customers and generate ideas. Salesforce.com, for one, is experimenting with expanding its enterprise social network, Chatter, to the outside world. Says Blau, “Chatter communities enable the sharing of ideas and information inside what is in essence a social network, but outside the company walls. We can launch our own communities around specific industry verticals or product areas and gather product feedback as well as new ideas for what people would like to see in the next release of our products—or really any crazy idea out there that they think might be great for Salesforce to take a look at.”
Catalent has also established a crowdsourcing process—called “Bright Ideas Are Everywhere.” It enables scientists and other innovators across the company, globally, to send in ideas. Evjatar Cohen and his team are always on the lookout, scouting for the “game changer.” “It provides a central location through which everybody can submit an innovation idea,” says Cohen. “I see every one of those ideas personally and my staff is available to jump on them immediately.”
The Tried and the True
The new digital enablers offer exciting opportunities for innovators, but they won’t diminish the importance of the more mature productivity tools that companies have turned to for years. Indeed, many of these tools are must-haves, as indicated by the frequency of their use among our survey respondents. The most common, project management tools, are used by almost 70 percent of companies in the development phase, and are also ranked among the three most effective tools in this phase.
For companies that undertake large, costly projects, project management tools are indispensable. Reinhold Achatz, head of corporate technology, innovation, and quality at German steelmaker ThyssenKrupp, is familiar with such projects. “Years ago, our biggest plants and system projects cost $200 million to $300 million,” he says. “Today, we are doing projects up to $1 billion. We are working on engineering at different sites with a lot of different people from different areas, and we are working with suppliers. These tools have transformed the way we work, by enabling us to manage increasingly complex efforts.”
Another highly effective productivity tool in the development phase is CAD software. CAD tools were rated lower in terms of usage, but that’s because they have a limited audience—these tools are much more commonly needed at companies in heavily engineering-oriented industries. Companies in both the auto and aerospace and defense industries use them extensively; fully two-thirds of our respondents from those industries reported using CAD software, compared with just 25 percent of companies overall (we’ll comment more about industry-specific usage of digital tools later on).
One company that has made effective use of CAD software to do 3D digital modeling is Electric Boat, a company with one product and one customer: It builds one nuclear submarine every year for the U.S. Navy, at a price tag of around $2 billion. Most of Electric Boat’s submarine engineering and design work is paid for directly under its contract with the Department of Defense—in early 2013, for instance, the company was awarded $1.8 billion to begin design work on the next generation of nuclear subs. The company’s own R&D work is performed by a small innovation group that investigates new technologies for designing and building the finished product.
For many years, the company built wooden mock-ups of submarines it was designing to make sure the ship could be built as proposed. But the Virginia-class submarines Electric Boat is building today were the first designed almost entirely digitally. “What you see now when you walk through our manufacturing space,” explains Mark Bennett, the company’s R&D program manager, “are 3D isometric pictures that come off of our digital [CAD] database. That’s what tradesmen work from. They’re not solely relying on notes on 2D paper drawings the way they used to. We use the database to laser mark on the steel where plates will attach, and provide detail on how big the welds need to be.” The digital files are also used in the company’s electronic visualization rooms. “We can project 3D models of the submarine,” Bennett says, “and that allows us to examine various spaces jointly with our customer.” Electric Boat is now investigating the use of those 3D models to generate holograms of the inside of a submarine to improve understanding of the submarine’s design and layout.
Rapid prototyping tools such as 3D printing are used by 34 percent of our survey respondents, and they are also ranked as the most effective productivity tools in the ideation phase (and in fact were ranked as more effective than any market and customer insight enabler at this stage). The R&D team at Philips Lighting, for example, now uses 3D printing to make mock-ups of its lighting fixtures to share new concepts both internally and with customers. In the past, such mock-ups took a great deal of time to produce. Now, says Esmeijer, “we can make a mock-up that people can look at and physically touch. They can make suggestions and corrections, and we can make another one in an hour.”
Finally, collaborative environments—tools such as messaging, video, file sharing, and Webinars—are used by 45 percent of our respondents, and indeed are critical at many companies with far-flung teams. However, our survey results show that the efficacy of collaboration tools is moderate. Their relatively modest effectiveness may be attributable to the logistical challenges of connecting people in different time zones around the world. Key to success is sufficient investment in training and design standards, without which the benefits of collaborative environments are illusory. For example, insufficient investment is one of the major barriers to successful engineering offshoring. But for those companies that have mastered their use, these tools can be a powerful means of bringing people together at the development phase.
Caterpillar’s Henricks believes that many of these collaboration tools have significantly improved productivity. Her company uses tools such as telepresence and Web-based communities to maintain interaction among R&D teams, as well as sales, marketing, and other functions around the world. “We truly can do R&D 24/7,” she says. “Now we can take data in our test labs here in North America or in Europe and send the file to India. Overnight, our engineers in India can analyze it [and] reach some conclusions, and the next morning, engineers in North America or Europe analyze those results and plan next steps.”
A Closer Look at Usage
Even as companies overall are making significant use of many digital tools, variations among companies in different industries remain considerable. Overall, software and Internet companies spent the largest portion of their R&D budget on deploying and operating digital tools, at 15 percent, followed by aerospace and defense companies, at 12 percent.
Interestingly, computing and electronics companies invested the smallest percentages of their budget on these tools—less than 6 percent. However, that still adds up to a significant amount, given their high overall R&D spend (see Exhibit 3).
Naturally, companies in different industries tend to use the tools that can help create their unique products and services. The aerospace and defense industry, for example, relies heavily on CAD software, visual simulation, and customer immersion labs. These are not among the most-used digital tools in other industries. With the industry’s high development costs and levels of complexity—building submarines, for instance—it is understandable that aerospace and defense companies would find these tools more useful than, say, social media dashboards. Companies in the software and Internet sector, however, make extensive use of social media, as well as monitoring and location detection of customer behavior and product usage—also no surprise, given that their B2C business models rely on customers who are highly likely to be online and mobile.
We also observed distinct differences in the level of usage (or adoption) of digital enablers by innovation strategy model. Since 2007, we have segmented companies into three distinct strategic groups—Need Seekers, Market Readers, and Technology Drivers. Need Seekers, the most prevalent model in the innovation hub that is Silicon Valley, engage customers directly to generate new ideas, then develop original products and services and get them to market first. Market Readers are fast followers. They typically generate ideas by closely monitoring their markets, customers, and competitors, focusing largely on creating value through incremental innovations to current products. And Technology Drivers depend heavily on their internal technological expertise to develop new products and services, driving both breakthrough innovation and incremental change, in hopes of meeting the known and unknown needs of their customers via new technology.
Over the years, our survey results have consistently shown that Need Seekers excel at several factors that promote innovation success: They do a better job at aligning their innovation strategies with their overall corporate strategies; they understand the importance of developing a focused set of innovation capabilities needed to carry out their strategy; and they turn their corporate culture to their advantage, ensuring that it supports their innovation strategy by maintaining a strong connection to their customers throughout the innovation process. They also have the strongest financial performance relative to their peers.
This year’s results suggest that Need Seekers are gaining yet another advantage, through their use of digital innovation tools. Fully 62 percent of respondents from companies we identified as Need Seekers make significant use of digital enablers, compared with just 48 percent of Technology Drivers and a mere 25 percent of Market Readers (see Exhibit 4). And of those Need Seekers, nearly 60 percent indicated they outperformed their competitors financially. That’s a testament to the power of these tools when they are in the right hands, but also to the fact that Need Seekers, the most active companies in seeking out customer insights in their R&D efforts, understand where the tools’ transformative promise might lie. Market Readers’ much less frequent use of digital enablers—particularly at the front end—reflects their incremental mind-set, which is more focused on process optimization.
The Implementation Challenge
Clearly, many companies have had considerable success with the full range of digital enablers. Implementing and using them, however, can be challenging. Who should lead the process? According to our survey, a quarter of companies turn to their business units to lead the effort, followed by product development teams at 22 percent, and CIOs at 20 percent. Just 16 percent of companies turn to their CTOs to lead the process of choosing and implementing digital tools. But almost half of respondents who let the CTO lead said their companies outperform their competitors, suggesting that uniting one’s innovation efforts under a single executive can be very effective.
Of course, working with the R&D and engineering teams is also important at this stage, not least because of the need to thoroughly train everyone who will be using the tools. When respondents were asked to name the key element for success in using digital tools, 39 percent said training programs. “It’s all about the engagement,” says Catalent’s Cohen. “For example, over the past couple of years we have implemented tools for portfolio management, [for] project management, and to manage our stage-gate process for enhancing collaboration. We chose these tools for several reasons—because they were economical, because the output was simple to understand and apply, and because the training process went smoothly.… It’s great to have the tools, but you must get everyone to apply them in the right way and to the right projects. Everyone must understand how to extract what they need to know to manage projects along the critical path to completion.”
Perhaps even more important is to ensure that everyone involved in using the tools and interpreting their results is on the same page—which doesn’t always happen when tools are adopted rapidly across various teams. James Fairweather, vice president of product architecture and technology development at Pitney Bowes, notes that at times, “the tool itself seems to be mature enough, but it may be that not everybody in the organization understands the output. Different stakeholders will have different expectations about what they’re going to see based on past experiences with larger programs that were run in more of a traditional format.” It is thus critical, he says, to make sure to set the context for expectations.
Esmeijer of Philips Lighting cautions that people must focus on the insights they desire from the tools, not simply the process of using them. “We have all kinds of tools at Philips that you can use to calculate or play with things. People very quickly jump on them, sometimes before they get the problem they’re trying to solve right. We want to make sure people think about the bigger picture—what we want to learn, or what we’re trying to manage—and then use the tool,” he explains. “In the end, lighting is a human experience.”
Finally, ensuring proper implementation of digital tools, in the experience of Matthias Kaiserswerth, the director of IBM’s Zurich Research Lab, requires a significant cultural effort. “There is definitely a generational component to the willingness to make use of many of these tools,” he says. “The learning curve can be rather steep, especially for older employees, so culture matters. Ensuring the involvement of top management is critical.”
The Importance of Being Bold
It’s essential to be prepared when adopting any digital improvement in your innovation process. And for productivity tools that require heavy investment, companies need to have good training in place, as well as internal consistency regarding what the tools can and can’t do, information formats, and usage conventions. When it comes to market and customer insight tools, however, our advice is to prioritize experimentation. Of course, the implementation issues noted by our interviewees must be taken into account, but the key is to leave yourself some room for flexibility. These tools, many of which are still unproven on any large scale, demand a bolder approach.
Companies need to be willing to spread the money around: Some of these tools, such as customer immersion labs and big data, will require significant investment. But the transformative benefits that insight tools can bring to your innovation process can far outweigh their costs. In our Global Innovation 1000 studies over the years, we’ve consistently found that a major innovation success factor is listening to what your customers have to say. And in fact, our 2007 survey revealed that companies that engaged directly with their customers had twice the return on assets and triple the growth in operating income of other responding companies. If customer insight is the next frontier of innovation, these digital tools will be game changers. They won’t replace productivity tools—efficiency at the development stage is crucial to sustained competitive advantage. But they will make a powerful addition to your digital tool kit.
Remember that even if you aren’t experimenting with these tools, chances are your competitors are, or they will be soon—and they will be the ones reaping the benefits. As Bill Blau of Salesforce.com told us, “The pace of business today does not allow for years to go by. If you’re not innovating now, you’re going to die quickly.” A better understanding of what customers and markets need will undoubtedly lead to the launch of more successful products. And yours could be the company developing them. ![]()
Profiling the Global Innovation 1000
After two years of close to 10 percent growth following the worldwide economic downturn, R&D spending among the Global Innovation 1000 increased by just 5.8 percent this year. This is in line with the average annual growth rate since 2002 of 5.5 percent, marking a return to business as usual. Still, two-thirds of the companies in our 2013 study increased their R&D spending, contributing to a total amount spent of US$638 billion—a $35 billion increase over 2012. (Data for the 2013 reporting period was gathered between July 2012 and June 2013. For more details, see “Methodology”.) Because the group’s total revenues increased by a mere 0.9 percent, to $17.7 trillion, R&D intensity—innovation spending as a percentage of revenues—rose two-tenths of a percent, reaching the highest R&D intensity level since 2010 (see Exhibit A).
The top 100 companies on the list accounted for 45 percent of the R&D spending growth and more than 60 percent of the total spent on innovation, and the top 20 companies alone made up almost a quarter of both total spending and spending growth. The list of the 20 largest spenders changed somewhat from last year (see Exhibit B). Volkswagen took the top spot, Samsung jumped from sixth to second, and Google made its first entrance in the top 20, at number 12. (Some of these shifts were a result of changes in how we accounted for R&D spending; see “Methodology.”) Outside the top 20, 89 new companies entered the Global Innovation 1000. They contributed more than $16 billion in R&D spending, a healthy addition given that the 89 companies leaving the list spent less than $9 billion in 2012.
Together, three sectors—computing and electronics, healthcare, and auto—accounted for 65 percent of overall R&D spending, about the same proportion as last year (see Exhibit C). But this year the software and Internet sector overtook computing and electronics as the largest contributor to the growth in R&D spending. The software and Internet sector added 10 companies to the Global Innovation 1000 and boosted its innovation spending by $9.3 billion—more than any other sector, by both measures.
Despite the fact that its spending makes up just 8 percent of total R&D spending, the software and Internet sector’s growth in spending appears to indicate that the tide is turning in favor of technologies that run our increasingly digitized world (see Exhibit D). In contrast, spending in the computing and electronics sector increased by just $3.4 billion—almost $10 billion less than last year’s growth total. Twelve of the 28 computing and electronics companies in the top 100 spent less than last year; even IBM just maintained the same level of spending. Still, the computing and electronics industry remains the highest-spending sector by a wide margin—27 percent of the total, compared with 22 percent for healthcare, the second-highest spender.
Meanwhile, spending growth in the auto sector slowed to just $7.4 billion in 2013 from $13.2 billion last year; the flurry of R&D surrounding the launch of new models in the past several years is clearly abating. The healthcare sector, however, increased spending by $9.2 billion in 2013, up from an increase of $6 billion the year before. The industry received a boost from several healthcare companies that increased their spending significantly, including Roche in Europe, Gilead in the United States, and Takeda in Japan. The chemicals and energy sector was the only one to see a decline in spending this year, falling by $2 billion. The decline was mostly on the chemicals side; energy companies increased their spending overall.
With a few notable exceptions, the geographic picture looks similar to last year’s (see Exhibit E). Innovation spending in companies headquartered in North America outpaced that of companies based in Europe and Japan (as well as the Global Innovation 1000 average), growing by 8.6 percent, although the number of companies in the Global Innovation 1000 from North America keeps decreasing—by nine this year, and there has been a decrease of 100 since 2008. In a promising turn of events, European companies increased spending by 4.5 percent despite the region’s continuing economic struggles. Spending in Japan, however, fell this year by 3.6 percent. The rest of the world, which includes India (but not China, which was counted separately this year), grew by an impressive 17.5 percent, although the group continues to make up a relatively small portion of the total Global Innovation 1000.
China saw a net gain of 15 companies on the list this year. In fact, since 2008, the number of Chinese companies in the Global Innovation 1000 has risen from 10 to 75, and the total amount spent on R&D by Chinese companies on the list rose from $1.7 billion in 2008 to $20.5 billion in 2013. Yet China’s increase in innovation spending slowed considerably in 2013, to 35.8 percent—a little more than half of its five-year compound annualized growth rate of 63.9 percent. That’s a reflection of the country’s rate of economic expansion, which is down considerably from recent years. Indeed, no region can be expected to sustain such high growth rates over the long term.
Although we’ve returned to the status quo in terms of overall R&D spending growth, certain companies, industries, and regions are clearly making waves this year.
The 10 Most Innovative Companies
This year’s list of the most innovative companies, as identified by our survey respondents, reflects the increasing importance of digitally oriented companies whose innovation efforts are transforming our working and personal lives.
Apple continues to lead the list, for the fourth year running (see Exhibit F). The company boosted its R&D spending by almost US$1 billion this year, to $3.4 billion, raising its rank among the Global Innovation 1000 from 53rd to 43rd. But its innovation intensity remained at just 2.2 percent, thanks largely to the impressive $157 billion it took in this year. However, Apple has also seen its share price fluctuate significantly, due in part to the fact that its iPhone market share has come under increasing pressure from Android phones, and that it has not developed a new killer product in quite a while. Perhaps as a result, just 62 percent of respondents named Apple as the top innovator this year, down considerably from the 80 percent who did so last year. But the company remains strong, and time will tell how it responds to rising pressures.
Google held steady at number two; half of respondents mentioned it, up 7 percentage points from last year. 3M fell to number five, overtaken by Samsung for the number three spot. Samsung’s steady climb up the list makes clear that it is not a mere copier of innovations pioneered by other companies. With its Galaxy smartphone, Smart TV, and other inventive products, the company is proving capable of designing devices and equipment almost as crowd-pleasing as Apple’s. Amazon, meanwhile, leaped from number 10 last year to number four. The company’s skill as an innovator no longer rests solely on the new ideas it brings to online retailing; its cloud service offerings are, by some accounts, more successful than those of the company’s many rivals.
The same companies as last year round out the next few spots, with some shifts in the order. But surprise entrant Tesla Motors shows up at number nine, having spent fully two-thirds of its $413 million in revenue on R&D, typical for a company that’s essentially still in startup mode. Facebook rejoined the list at number 10, probably attributable to its quickly evolving mobile strategy. Continuing a now four-year trend, no healthcare company made the list.
The 10 companies deemed most innovative again had a much better year financially than the top 10 spenders on R&D, surpassing them in terms of both five-year revenue and market cap growth averages (see Exhibit G). The top 10 spenders managed only to keep up with the 10 most innovative companies in the five-year average of the earnings margin, and failed even to match their industry peers in terms of growth in both revenue and market cap. The list of top spenders is still dominated by auto and healthcare companies. From these sectors, only one company, tiny Tesla, appears on the list of top innovators—demonstrating once again that innovation success isn’t about how much money companies spend, but how they spend it.
Methodology
As it has in each of the past eight editions of the Global Innovation 1000 study, this year Booz & Company identified the 1,000 public companies around the world that spent the most on R&D during the last fiscal year, as of June 30, 2013. To be included, companies had to make their R&D spending numbers public. Subsidiaries that were more than 50 percent owned by a single corporate parent during the period were excluded if their financial results were included in the parent company’s financials.
In order to gain a more accurate and complete picture of innovation spending, we made some adjustments to our data collection process. In past years, both capitalized and amortized R&D expenditures were excluded.
This year, for companies with capitalized R&D expenditures, we included the most recent fiscal year’s amortization of those costs in calculating the total R&D investment, while continuing to exclude any non-amortized capitalized costs.
For each of the top 1,000 companies, we obtained the key financial metrics for 2008 through 2013, including sales, gross profit, operating profit, net profit, historical R&D expenditures, and market capitalization. All sales and R&D expenditure figures in foreign currencies were translated into U.S. dollars according to an average of the exchange rate over the relevant period; for data on share prices, we used the exchange rate on the last day of the period. In addition, figures for total shareholder return were gathered and adjusted to reflect each company’s total shareholder return in its local market.
All companies were coded into one of nine industry sectors (or “other”) according to Bloomberg’s industry designations, and into one of five regional designations, as determined by their reported headquarters locations. To enable meaningful comparisons across industries, we indexed the R&D spending levels and financial performance metrics of each company against the average values in its own industry.
To understand how companies apply digital enablers across the innovation chain, we conducted an online survey of nearly 400 senior managers and R&D professionals from more than 350 different companies around the globe. The companies participating represented more than US$162 billion in R&D spending, or 25 percent of this year’s total Global Innovation 1000 R&D spending, all nine of the industry sectors, and all five geographic regions.
We asked respondents to describe their company’s use of digital tools at each stage of the innovation process, the tools’ effectiveness, how much they spent on them, and the factors that enable them to succeed, as well as their perception of their company’s financial performance. Using a variety of statistical methods, we also identified the digital enablers most prevalent among companies following each of the three innovation strategy models (Need Seeker, Technology Driver, or Market Reader). Company names and responses were kept confidential unless permission to use them was explicitly granted. Finally, to gain further insight, we interviewed executives who work with digital tools as part of their role in their company’s innovation practice.
Reprint No. 00221
Author profiles:
- Barry Jaruzelski is a senior partner with Booz & Company in Florham Park, N.J., and the global leader of the firm’s engineered products and services practice. He created the Global Innovation 1000 study in 2005, and continues to lead the research. He works with high-tech and industrial clients on corporate and product strategy and the transformation of core innovation processes.
- John Loehr is a partner with Booz & Company based in Chicago, and is the global leader of the firm’s innovation practice. He works with automotive, industrial, and technology companies to help them build competitive innovation capabilities and to resolve critical decisions in their product and market strategies.
- Richard Holman is a partner with Booz & Company based in Florham Park, N.J. As a senior leader of the firm’s innovation practice, he works with clients in highly engineered products sectors such as aerospace, industrials, high tech, and healthcare on innovation capability building, new product development efficiency and effectiveness, and product management.
- Also contributing to this article were s+b contributing editor Edward H. Baker and Booz & Company senior associate Stefan Luckner and senior analyst Jennifer Ding.